Estimated Value: $279,593 - $374,000
3
Beds
2
Baths
1,607
Sq Ft
$195/Sq Ft
Est. Value
About This Home
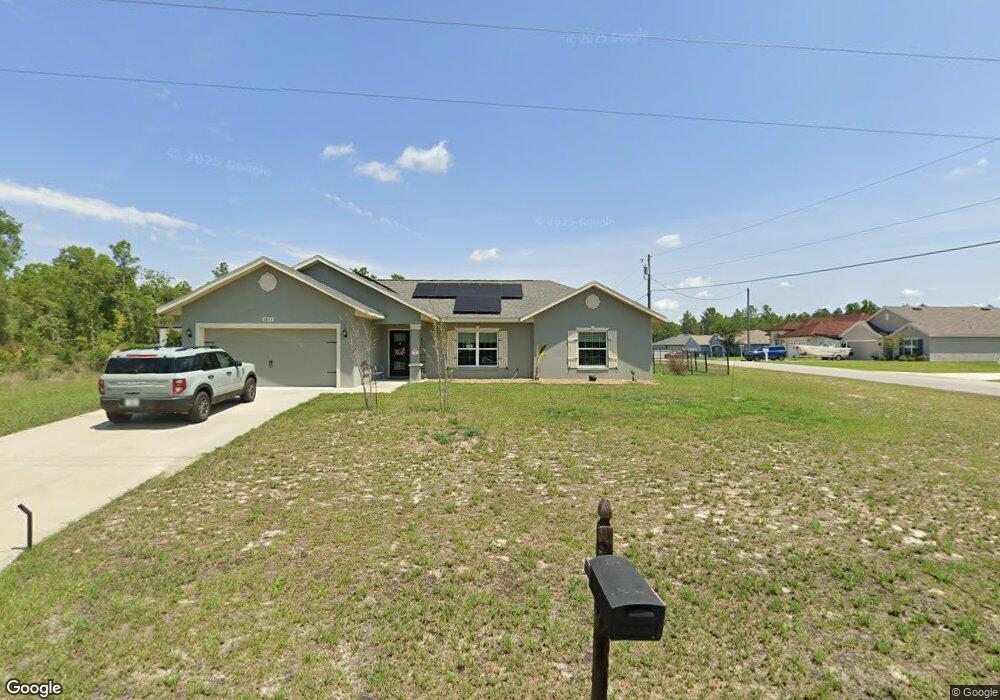
This home is located at 8883 SW 135th Place, Ocala, FL 34473 and is currently estimated at $314,148, approximately $195 per square foot. 8883 SW 135th Place is a home located in Marion County with nearby schools including Marion Oaks Elementary School, Horizon Academy At Marion Oaks, and Dunnellon High School.
Ownership History
Date
Name
Owned For
Owner Type
Purchase Details
Closed on
Mar 31, 2020
Sold by
Charity Paul Scott and Charity Cynthia L
Bought by
Moniz Barbara J and Moniz Leonard F
Current Estimated Value
Home Financials for this Owner
Home Financials are based on the most recent Mortgage that was taken out on this home.
Original Mortgage
$131,000
Outstanding Balance
$116,050
Interest Rate
3.4%
Mortgage Type
New Conventional
Estimated Equity
$198,098
Purchase Details
Closed on
Mar 22, 2019
Sold by
Hart Waal Nimi and Maharj Mitra S
Bought by
Scott Charity Paul and Charity Cynthia L
Purchase Details
Closed on
May 2, 2002
Sold by
The Deltona Corp
Bought by
Hart Waal Nimi and Maharaj Mitra S
Home Financials for this Owner
Home Financials are based on the most recent Mortgage that was taken out on this home.
Original Mortgage
$15,280
Interest Rate
8.9%
Mortgage Type
Seller Take Back
Create a Home Valuation Report for This Property
The Home Valuation Report is an in-depth analysis detailing your home's value as well as a comparison with similar homes in the area
Home Values in the Area
Average Home Value in this Area
Purchase History
| Date | Buyer | Sale Price | Title Company |
|---|---|---|---|
| Moniz Barbara J | $191,000 | Stewart Title Company | |
| Scott Charity Paul | $7,500 | A1 Title Of The Nature Coast | |
| Hart Waal Nimi | $19,100 | Five Points Title Svcs Co In |
Source: Public Records
Mortgage History
| Date | Status | Borrower | Loan Amount |
|---|---|---|---|
| Open | Moniz Barbara J | $131,000 | |
| Previous Owner | Hart Waal Nimi | $15,280 |
Source: Public Records
Tax History Compared to Growth
Tax History
| Year | Tax Paid | Tax Assessment Tax Assessment Total Assessment is a certain percentage of the fair market value that is determined by local assessors to be the total taxable value of land and additions on the property. | Land | Improvement |
|---|---|---|---|---|
| 2024 | $3,242 | $210,731 | -- | -- |
| 2023 | $3,162 | $204,593 | $0 | $0 |
| 2022 | $3,052 | $198,634 | $11,800 | $186,834 |
| 2021 | $3,005 | $150,551 | $5,100 | $145,451 |
| 2020 | $180 | $4,800 | $4,800 | $0 |
| 2019 | $174 | $5,350 | $5,350 | $0 |
| 2018 | $166 | $5,050 | $5,050 | $0 |
| 2017 | $149 | $3,100 | $3,100 | $0 |
| 2016 | $146 | $2,890 | $0 | $0 |
| 2015 | $162 | $3,740 | $0 | $0 |
| 2014 | $158 | $3,400 | $0 | $0 |
Source: Public Records
Map
Nearby Homes
- TBD SW 135th St
- 13480 SW 87th Cir
- 8695 SW 133rd Lane Rd
- N/A SW 89th Terrace
- 13342 SW 88th Ct
- 13322 SW 85th Cir
- 13265 SW 85th Cir
- 13277 SW 85th Cir
- 8628 SW 133rd Lane Rd
- 0 SW 138th Ln Unit MFRC7507092
- 8725 SW 138 Ln
- 13350 SW 86th Ave
- 8730 SW 139th Place Rd
- 8490 SW 133rd Lane Rd
- lot 24 SW 89 Cir
- 13831 SW 89 Cir
- 0 SW 88th Unit MFROM707100
- 0 SW 88th Unit MFROM701539
- 8871 SW 129th Place
- 8457 SW 138th Place
- 13517 SW 88th Terrace
- 13535 SW 88th Terrace
- 13547 SW 88th Terrace
- 13495 SW 88th Terrace
- 0 SW 135th Place Unit MFROM549282
- 0 SW 135th Place Unit OM549281
- 0 SW 135th Place
- 87th Cir SW 135th Place
- 8848 SW 134th Place
- 8836 SW 134th Place
- 8801 SW 135th Place
- 8802 SW 135th Place
- 13440 SW 88th Terrace
- 13374 SW 88th Terrace
- 13530 SW 87th Cir
- 13530 SW 58th Cir
- 13565 SW 87th Cir
- 0 SW 134th Place
- 8790 SW 135th Place
- 13390 SW 87th Cir