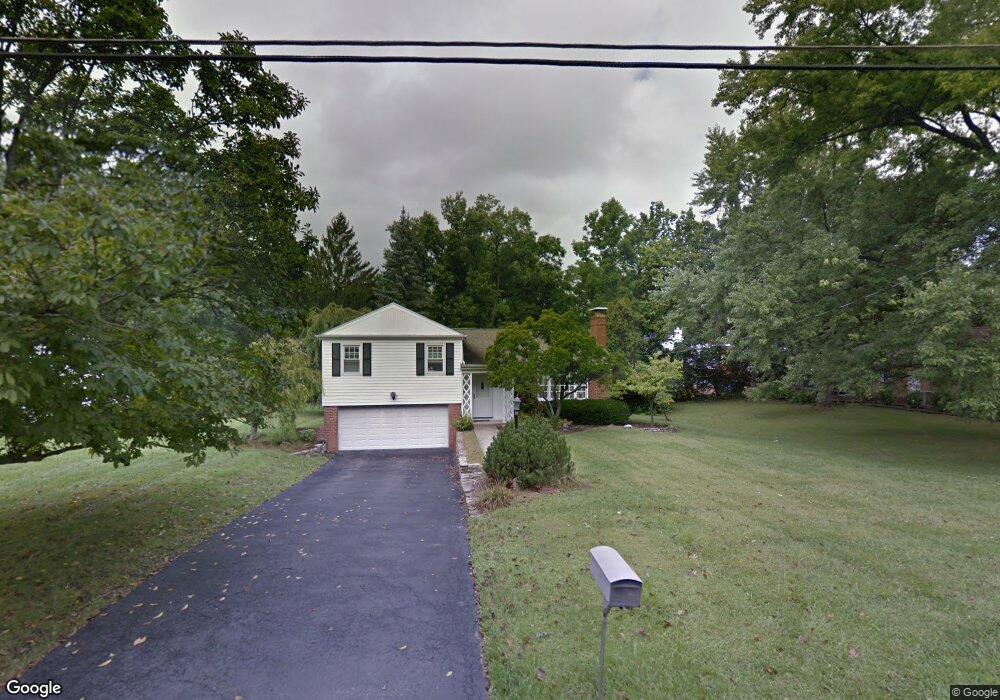
8885 Appleknoll Ln Cincinnati, OH 45236
Estimated Value: $775,000 - $996,789
3
Beds
3
Baths
3,150
Sq Ft
$282/Sq Ft
Est. Value
About This Home
This home is located at 8885 Appleknoll Ln, Cincinnati, OH 45236 and is currently estimated at $887,947, approximately $281 per square foot. 8885 Appleknoll Ln is a home located in Hamilton County with nearby schools including Indian Hill Primary School, Indian Hill Elementary School, and Indian Hill Middle School.
Ownership History
Date
Name
Owned For
Owner Type
Purchase Details
Closed on
Jul 21, 2013
Sold by
Ddt Holding Llc
Bought by
Whelan Jeffrey J and Whelan Kelly M
Current Estimated Value
Purchase Details
Closed on
Mar 1, 2010
Sold by
Whelan Jeff and Whelan Kelly
Bought by
Ddt Holdings Llc
Purchase Details
Closed on
Feb 11, 2009
Sold by
Mediwala Rahul and Basho Shruti
Bought by
Whelan Jeff and Whelan Kelly
Purchase Details
Closed on
Jun 25, 2003
Sold by
Braatz Willi Tr
Bought by
Mediwala Rahul and Basho Shruti
Home Financials for this Owner
Home Financials are based on the most recent Mortgage that was taken out on this home.
Original Mortgage
$177,600
Interest Rate
4.25%
Mortgage Type
Unknown
Purchase Details
Closed on
Aug 29, 1994
Sold by
Braatz Willi
Bought by
Braatz Willi
Create a Home Valuation Report for This Property
The Home Valuation Report is an in-depth analysis detailing your home's value as well as a comparison with similar homes in the area
Home Values in the Area
Average Home Value in this Area
Purchase History
| Date | Buyer | Sale Price | Title Company |
|---|---|---|---|
| Whelan Jeffrey J | -- | None Available | |
| Ddt Holdings Llc | -- | Attorney | |
| Whelan Jeff | $208,000 | Prominent Title Agency Llc | |
| Mediwala Rahul | $222,000 | -- | |
| Braatz Willi | -- | -- |
Source: Public Records
Mortgage History
| Date | Status | Borrower | Loan Amount |
|---|---|---|---|
| Previous Owner | Mediwala Rahul | $177,600 | |
| Closed | Mediwala Rahul | $33,300 |
Source: Public Records
Tax History Compared to Growth
Tax History
| Year | Tax Paid | Tax Assessment Tax Assessment Total Assessment is a certain percentage of the fair market value that is determined by local assessors to be the total taxable value of land and additions on the property. | Land | Improvement |
|---|---|---|---|---|
| 2024 | $11,586 | $296,986 | $47,401 | $249,585 |
| 2023 | $11,656 | $296,986 | $47,401 | $249,585 |
| 2022 | $11,227 | $234,094 | $33,775 | $200,319 |
| 2021 | $10,936 | $234,094 | $33,775 | $200,319 |
| 2020 | $9,754 | $234,094 | $33,775 | $200,319 |
| 2019 | $9,175 | $205,346 | $29,628 | $175,718 |
| 2018 | $9,194 | $205,346 | $29,628 | $175,718 |
| 2017 | $8,767 | $205,346 | $29,628 | $175,718 |
| 2016 | $7,168 | $170,251 | $27,472 | $142,779 |
| 2015 | $7,752 | $170,251 | $27,472 | $142,779 |
| 2014 | $1,241 | $27,472 | $27,472 | $0 |
| 2013 | $2,886 | $61,335 | $26,933 | $34,402 |
Source: Public Records
Map
Nearby Homes
- 6494 Pepperell Ln
- 6399 Donjoy Dr
- 7775 Hartfield Place
- 8530 Sturbridge Dr
- 5760 Kugler Mill Rd
- 7936 Keller Rd
- 6640 Kugler Mill Rd
- 7266 E Galbraith Rd
- 7268 E Galbraith Rd
- 6250 Cooper Rd
- 9500 Todd Dr
- 7747 Kugler Mill Rd
- 9506 Park Manor Blvd
- 9470 Wynnecrest Dr
- 4736 Alpine Ave
- 4648 Belleview Ave
- 9001 Cherry St
- 7821 Greenbriar Ln
- 8811 Pine Rd
- 4611 Belleview Ave
- 8873 Appleknoll Ln
- 8897 Appleknoll Ln
- 7671 Glenover Dr
- 8861 Appleknoll Ln
- 7641 Glenover Dr
- 7623 Glenover Dr
- 7701 Glenover Dr
- 8884 Appleknoll Ln
- 8849 Appleknoll Ln
- Lot 5 Glenover Dr
- Lot 6 Glenover Dr
- Lot 1 Glenover Dr
- Lot 2 Glenover Dr
- 8870 Appleknoll Ln
- 8907 Appleknoll Ln
- 7670 Glenover Dr
- 7601 Glenover Dr
- 7654 Glenover Dr
- 8850 Appleknoll Ln
- 8837 Appleknoll Ln