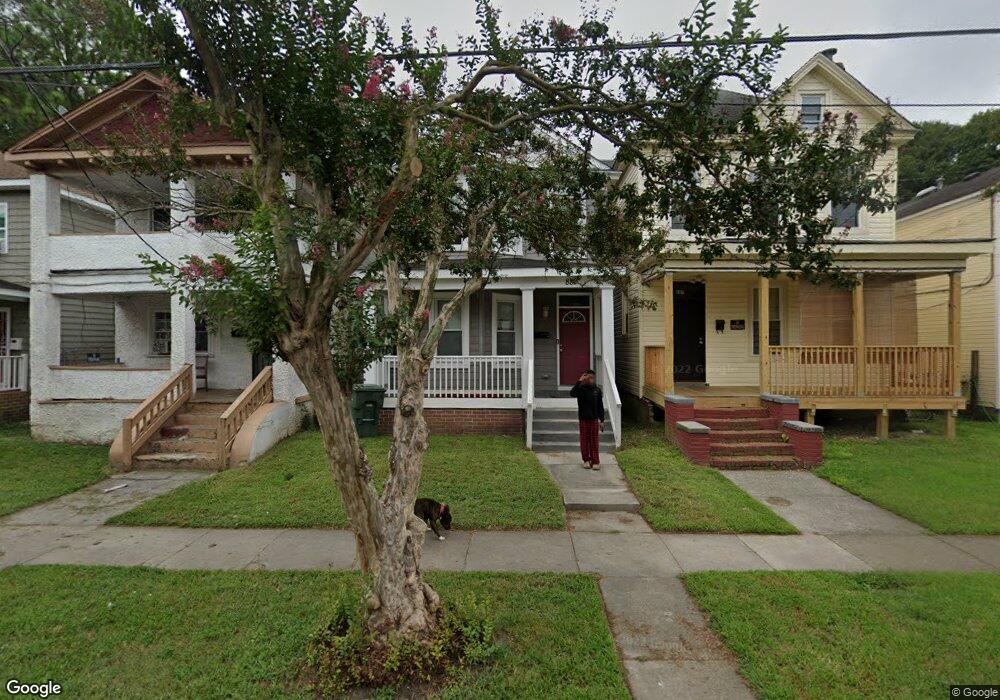
889 A Ave Norfolk, VA 23504
Olde Huntersville NeighborhoodEstimated Value: $198,000 - $238,000
4
Beds
2
Baths
1,516
Sq Ft
$146/Sq Ft
Est. Value
About This Home
This home is located at 889 A Ave, Norfolk, VA 23504 and is currently estimated at $221,333, approximately $145 per square foot. 889 A Ave is a home located in Norfolk City with nearby schools including Jacox Elementary School, Blair Middle School, and Granby High School.
Ownership History
Date
Name
Owned For
Owner Type
Purchase Details
Closed on
Mar 24, 2017
Sold by
Patel Parshottambhai and Patel Anandiben
Bought by
New Norfolk Homes Llc
Current Estimated Value
Purchase Details
Closed on
Jun 27, 2013
Sold by
Carelli Gerard
Bought by
Patel Parshottambhai and Patel Anandiben
Purchase Details
Closed on
Jul 6, 2009
Sold by
Aurora Loan Services Llc
Bought by
Carelli Gerard
Purchase Details
Closed on
Jul 16, 2008
Sold by
Mcdole Danielle
Bought by
Aurora Loan Services Llc
Purchase Details
Closed on
Dec 1, 2004
Sold by
Bank One National Assn
Bought by
Mcdole Danielle S
Create a Home Valuation Report for This Property
The Home Valuation Report is an in-depth analysis detailing your home's value as well as a comparison with similar homes in the area
Home Values in the Area
Average Home Value in this Area
Purchase History
| Date | Buyer | Sale Price | Title Company |
|---|---|---|---|
| New Norfolk Homes Llc | $29,500 | Advance Title & Abstract | |
| Patel Parshottambhai | $18,000 | None Available | |
| Carelli Gerard | $23,000 | Sun Title Inc | |
| Aurora Loan Services Llc | $109,558 | None Available | |
| Mcdole Danielle S | $63,000 | -- |
Source: Public Records
Tax History
| Year | Tax Paid | Tax Assessment Tax Assessment Total Assessment is a certain percentage of the fair market value that is determined by local assessors to be the total taxable value of land and additions on the property. | Land | Improvement |
|---|---|---|---|---|
| 2025 | $2,280 | $182,400 | $29,500 | $152,900 |
| 2024 | $2,031 | $165,100 | $29,500 | $135,600 |
| 2023 | $1,975 | $158,000 | $29,500 | $128,500 |
| 2022 | $1,731 | $138,500 | $20,400 | $118,100 |
| 2021 | $1,551 | $124,100 | $17,000 | $107,100 |
| 2020 | $1,551 | $124,100 | $17,000 | $107,100 |
| 2019 | $1,388 | $111,000 | $17,000 | $94,000 |
| 2018 | $1,398 | $111,800 | $17,000 | $94,800 |
| 2017 | $1,084 | $94,300 | $17,000 | $77,300 |
| 2016 | $1,064 | $87,200 | $17,000 | $70,200 |
| 2015 | $1,003 | $87,200 | $17,000 | $70,200 |
| 2014 | $1,003 | $87,200 | $17,000 | $70,200 |
Source: Public Records
Map
Nearby Homes
- 830 Fremont St Unit ABCD
- 942 Sutton St
- 857 B Ave
- 859 Lexington St
- 1004 Barney St
- 755 A Ave
- 823 Washington Ave
- 746 A Ave
- 765 C Ave
- 741 Washington Ave
- 714 Fremont St
- 904 Pollard St
- 1520 Church St
- 742 Johnson Ave
- 2406 Masi St
- 944 Gordon Ave
- 956 Gordon Ave
- 2655 Barre St
- 912 Lindenwood Ave
- 702 Howard Place
Your Personal Tour Guide
Ask me questions while you tour the home.