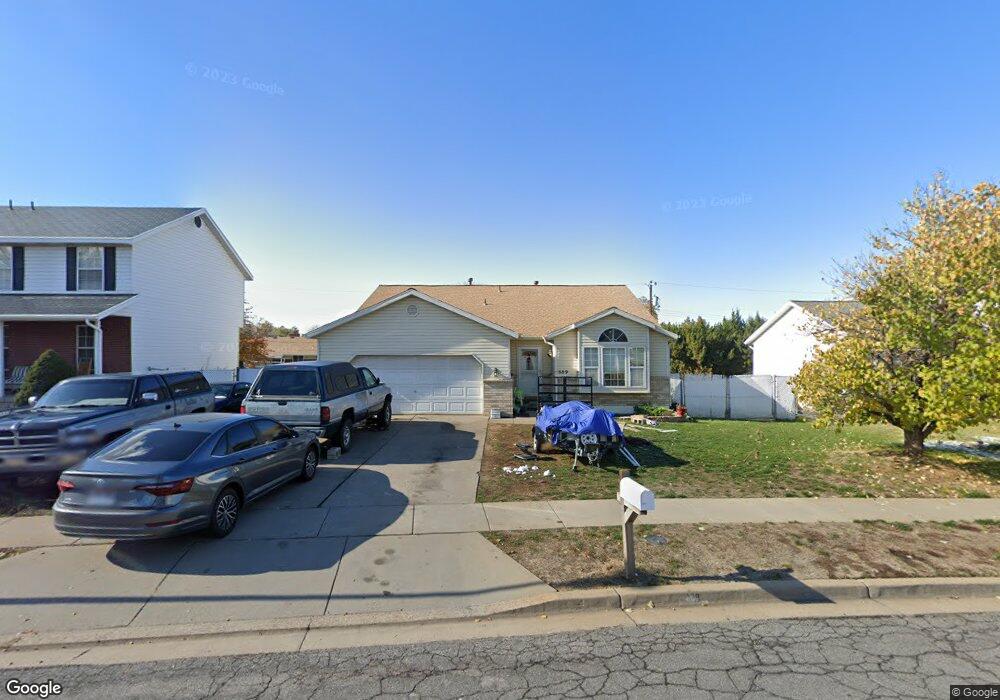
889 N 275 W Bountiful, UT 84010
Estimated Value: $498,000 - $613,000
3
Beds
2
Baths
3,212
Sq Ft
$174/Sq Ft
Est. Value
About This Home
This home is located at 889 N 275 W, Bountiful, UT 84010 and is currently estimated at $559,131, approximately $174 per square foot. 889 N 275 W is a home located in Davis County with nearby schools including Meadowbrook Elementary School, Bountiful Junior High School, and Viewmont High School.
Ownership History
Date
Name
Owned For
Owner Type
Purchase Details
Closed on
Mar 20, 2020
Sold by
Jenkins Robert
Bought by
Jenkins Anna M and Jenkins Robert C
Current Estimated Value
Purchase Details
Closed on
Apr 14, 2003
Sold by
Jorgensen Allen R and Jorgensen Margaret
Bought by
Jenkins Robert and Jenkins Anna
Home Financials for this Owner
Home Financials are based on the most recent Mortgage that was taken out on this home.
Original Mortgage
$135,000
Outstanding Balance
$56,849
Interest Rate
5.6%
Estimated Equity
$502,282
Purchase Details
Closed on
Aug 30, 2002
Sold by
Jorgensen Allen R and Jorgensen Margaret W
Bought by
Jorgensen Allen R and Jorgensen Margaret
Home Financials for this Owner
Home Financials are based on the most recent Mortgage that was taken out on this home.
Original Mortgage
$63,500
Interest Rate
5.69%
Create a Home Valuation Report for This Property
The Home Valuation Report is an in-depth analysis detailing your home's value as well as a comparison with similar homes in the area
Home Values in the Area
Average Home Value in this Area
Purchase History
| Date | Buyer | Sale Price | Title Company |
|---|---|---|---|
| Jenkins Anna M | -- | None Available | |
| Jenkins Anna M | -- | None Available | |
| Jenkins Robert | -- | Bonneville Title Company Inc | |
| Jorgensen Allen R | -- | Bonneville Title Company Inc |
Source: Public Records
Mortgage History
| Date | Status | Borrower | Loan Amount |
|---|---|---|---|
| Open | Jenkins Robert | $135,000 | |
| Previous Owner | Jorgensen Allen R | $63,500 |
Source: Public Records
Tax History Compared to Growth
Tax History
| Year | Tax Paid | Tax Assessment Tax Assessment Total Assessment is a certain percentage of the fair market value that is determined by local assessors to be the total taxable value of land and additions on the property. | Land | Improvement |
|---|---|---|---|---|
| 2025 | $3,104 | $284,900 | $124,641 | $160,259 |
| 2024 | $3,025 | $274,449 | $109,181 | $165,268 |
| 2023 | $3,067 | $264,550 | $111,615 | $152,934 |
| 2022 | $3,299 | $542,000 | $202,500 | $339,500 |
| 2021 | $2,724 | $395,000 | $145,671 | $249,329 |
| 2020 | $2,489 | $350,000 | $124,015 | $225,985 |
| 2019 | $2,419 | $344,000 | $136,245 | $207,755 |
| 2018 | $2,257 | $316,000 | $131,142 | $184,858 |
| 2016 | $1,965 | $149,050 | $53,886 | $95,164 |
| 2015 | $1,882 | $134,585 | $53,886 | $80,699 |
| 2014 | $1,656 | $120,850 | $53,886 | $66,964 |
| 2013 | -- | $113,319 | $36,190 | $77,129 |
Source: Public Records
Map
Nearby Homes
- 366 W 1000 N
- 810 Park Shadows Cir
- 553 N 200 W
- 790 N 500 W
- 1194 N 200 W
- 499 N 200 W Unit 30
- 499 N 200 W Unit 19
- 1260 N 200 W
- 93 W 700 N
- 1410 N 200 W
- 399 W 400 N Unit 47
- Lincoln Farmhouse Plan at Belmont Farms
- Belmont Traditional Plan at Belmont Farms
- Hampton Traditional Plan at Belmont Farms
- 16 W 700 N
- 340 N 500 W Unit 204
- 29 W Lady Ln
- 17 E 400 N Unit 27C
- 155 N Peregrine Ln W
- 1552 N 200 W