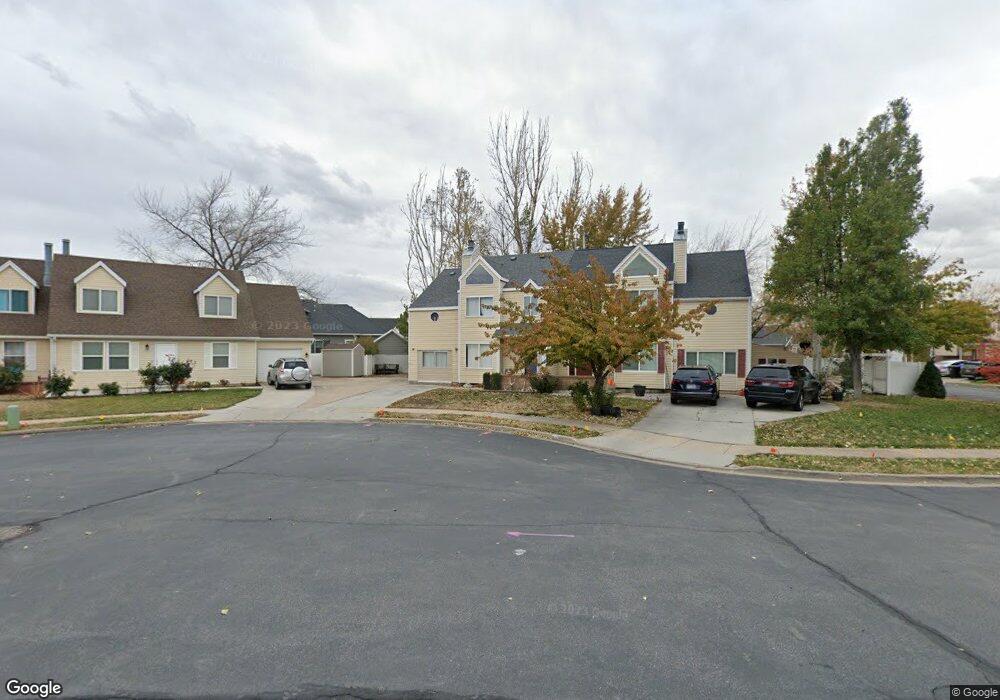
889 Raintree Cir West Bountiful, UT 84087
Estimated Value: $429,641 - $478,000
3
Beds
3
Baths
2,004
Sq Ft
$226/Sq Ft
Est. Value
About This Home
This home is located at 889 Raintree Cir, West Bountiful, UT 84087 and is currently estimated at $453,660, approximately $226 per square foot. 889 Raintree Cir is a home located in Davis County with nearby schools including West Bountiful Elementary School, Bountiful Junior High School, and Viewmont High School.
Ownership History
Date
Name
Owned For
Owner Type
Purchase Details
Closed on
Jan 28, 2004
Sold by
Carlson Mark L
Bought by
Carlson Mark L and Carlson Holly T
Current Estimated Value
Purchase Details
Closed on
Dec 3, 2002
Sold by
Carlson Mark L and Carlson Holly T
Bought by
Carlson Mark L
Home Financials for this Owner
Home Financials are based on the most recent Mortgage that was taken out on this home.
Original Mortgage
$105,600
Outstanding Balance
$16,940
Interest Rate
6.28%
Estimated Equity
$436,720
Purchase Details
Closed on
Dec 26, 1996
Sold by
Casper Carole H and Nelson Carole Ann H
Bought by
Carlson Mark L and Carlson Holly T
Home Financials for this Owner
Home Financials are based on the most recent Mortgage that was taken out on this home.
Original Mortgage
$90,000
Interest Rate
7.59%
Purchase Details
Closed on
Dec 17, 1996
Sold by
Crawford Roger L
Bought by
Casper Carole H
Home Financials for this Owner
Home Financials are based on the most recent Mortgage that was taken out on this home.
Original Mortgage
$90,000
Interest Rate
7.59%
Create a Home Valuation Report for This Property
The Home Valuation Report is an in-depth analysis detailing your home's value as well as a comparison with similar homes in the area
Home Values in the Area
Average Home Value in this Area
Purchase History
| Date | Buyer | Sale Price | Title Company |
|---|---|---|---|
| Carlson Mark L | -- | Cottonwood Title | |
| Carlson Mark L | -- | Cottonwood Title Ins Agency | |
| Carlson Mark L | -- | Backman Stewart Title Servic | |
| Casper Carole H | -- | Backman Stewart Title Servic |
Source: Public Records
Mortgage History
| Date | Status | Borrower | Loan Amount |
|---|---|---|---|
| Open | Carlson Mark L | $105,600 | |
| Closed | Carlson Mark L | $90,000 |
Source: Public Records
Tax History Compared to Growth
Tax History
| Year | Tax Paid | Tax Assessment Tax Assessment Total Assessment is a certain percentage of the fair market value that is determined by local assessors to be the total taxable value of land and additions on the property. | Land | Improvement |
|---|---|---|---|---|
| 2025 | $2,778 | $210,650 | $102,226 | $108,424 |
| 2024 | $2,547 | $203,500 | $83,163 | $120,337 |
| 2023 | $2,519 | $369,000 | $163,834 | $205,166 |
| 2022 | $2,456 | $202,400 | $0 | $202,400 |
| 2021 | $2,090 | $296,000 | $36,000 | $260,000 |
| 2020 | $2,090 | $257,000 | $35,400 | $221,600 |
| 2019 | $1,822 | $253,000 | $34,000 | $219,000 |
| 2018 | $1,720 | $228,000 | $34,000 | $194,000 |
| 2016 | $1,348 | $99,825 | $18,700 | $81,125 |
| 2015 | $1,304 | $87,615 | $18,700 | $68,915 |
| 2014 | $1,285 | $92,647 | $20,983 | $71,664 |
| 2013 | -- | $81,955 | $11,941 | $70,014 |
Source: Public Records
Map
Nearby Homes
- 825 W 1320 N
- 767 W 220 N
- 280 N 1100 W
- 637 W 1600 N
- 1084 W Audrey Ln Unit 20
- 1084 W Audrey Ln
- 790 N 500 W
- 366 W 1000 N
- 340 N 500 W Unit 204
- 789 W 1950 N
- Lincoln Farmhouse Plan at Belmont Farms
- Belmont Traditional Plan at Belmont Farms
- Hampton Traditional Plan at Belmont Farms
- 399 W 400 N Unit 47
- 988 W 1950 N Unit 134
- 2035 N 800 W
- 680 W 500 S Unit 22
- 680 W 500 S Unit 17
- 1503 N 300 W
- 553 N 200 W
- 895 Raintree Cir
- 885 Raintree Cir
- 932 N 900 W
- 888 W Heritage Point Ln Unit 9
- 881 Raintree Cir
- 876 W 850 N Unit 10
- 879 Raintree Cir
- 880 Raintree Cir
- 862 Heritage Point Ln
- 894 Raintree Cir
- 854 W 850 N Unit 11
- 907 N 900 W
- 923 N 900 W
- 882 Raintree Cir
- 893 N 900 W
- 937 N 900 W
- 875 Summer Tree Dr
- 933 Pinetree Cir
- 951 N 900 W
- 925 Pinetree Cir