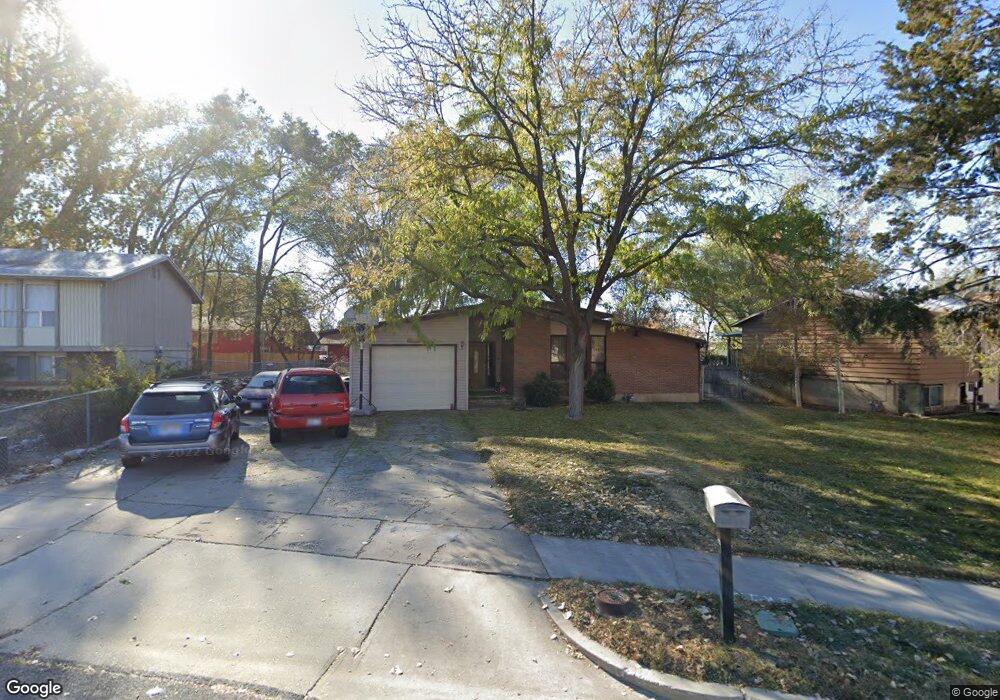
889 W 2600 N Clearfield, UT 84015
Estimated Value: $424,000 - $444,373
3
Beds
2
Baths
2,266
Sq Ft
$190/Sq Ft
Est. Value
About This Home
This home is located at 889 W 2600 N, Clearfield, UT 84015 and is currently estimated at $429,843, approximately $189 per square foot. 889 W 2600 N is a home located in Davis County with nearby schools including Fremont School, Sunset Junior High School, and Northridge High School.
Ownership History
Date
Name
Owned For
Owner Type
Purchase Details
Closed on
Feb 20, 2008
Sold by
Pelca Lee and Pelca Janet M
Bought by
Maresh Brandon L and Johnson Amanda S
Current Estimated Value
Home Financials for this Owner
Home Financials are based on the most recent Mortgage that was taken out on this home.
Original Mortgage
$157,000
Outstanding Balance
$97,938
Interest Rate
5.85%
Mortgage Type
Purchase Money Mortgage
Estimated Equity
$331,905
Create a Home Valuation Report for This Property
The Home Valuation Report is an in-depth analysis detailing your home's value as well as a comparison with similar homes in the area
Home Values in the Area
Average Home Value in this Area
Purchase History
| Date | Buyer | Sale Price | Title Company |
|---|---|---|---|
| Maresh Brandon L | -- | Mountain View Title & Escrow |
Source: Public Records
Mortgage History
| Date | Status | Borrower | Loan Amount |
|---|---|---|---|
| Open | Maresh Brandon L | $157,000 |
Source: Public Records
Tax History Compared to Growth
Tax History
| Year | Tax Paid | Tax Assessment Tax Assessment Total Assessment is a certain percentage of the fair market value that is determined by local assessors to be the total taxable value of land and additions on the property. | Land | Improvement |
|---|---|---|---|---|
| 2025 | $2,420 | $232,650 | $96,492 | $136,158 |
| 2024 | $2,339 | $226,050 | $105,414 | $120,636 |
| 2023 | $2,141 | $383,000 | $121,077 | $261,923 |
| 2022 | $2,279 | $225,500 | $72,674 | $152,826 |
| 2021 | $2,064 | $303,000 | $93,336 | $209,664 |
| 2020 | $1,776 | $258,000 | $80,582 | $177,418 |
| 2019 | $1,720 | $244,000 | $91,817 | $152,183 |
| 2018 | $1,542 | $215,000 | $77,250 | $137,750 |
| 2016 | $1,339 | $96,360 | $30,344 | $66,016 |
| 2015 | $1,290 | $88,275 | $30,344 | $57,931 |
| 2014 | $1,213 | $84,338 | $30,344 | $53,994 |
| 2013 | -- | $80,115 | $25,230 | $54,885 |
Source: Public Records
Map
Nearby Homes