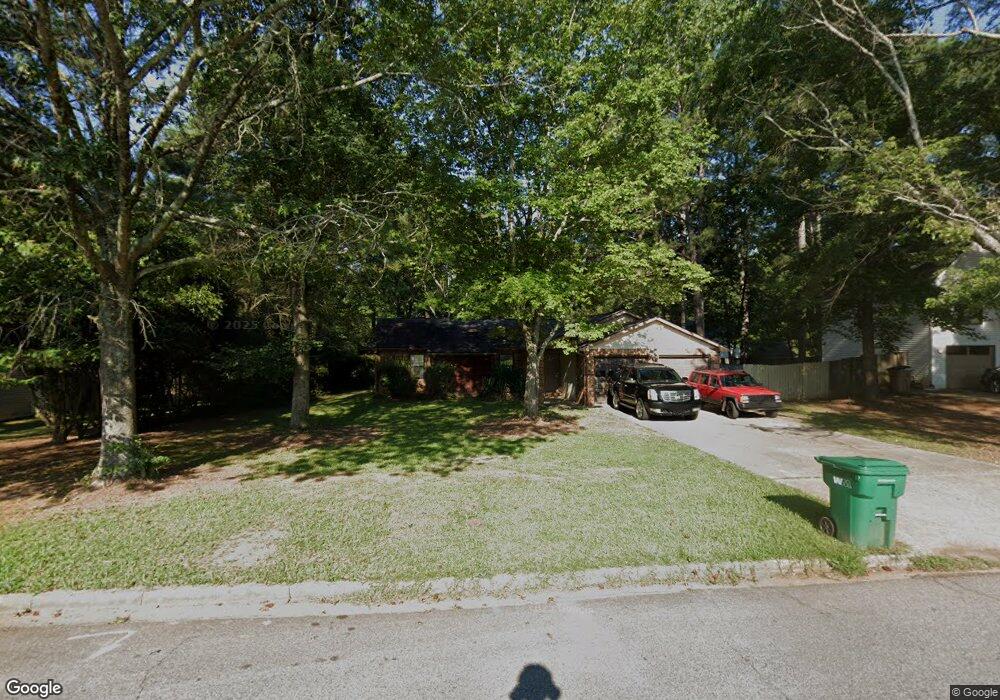
8893 Gardener Dr Unit 3 Jonesboro, GA 30238
Estimated Value: $204,394 - $229,000
3
Beds
2
Baths
1,264
Sq Ft
$169/Sq Ft
Est. Value
About This Home
This home is located at 8893 Gardener Dr Unit 3, Jonesboro, GA 30238 and is currently estimated at $213,849, approximately $169 per square foot. 8893 Gardener Dr Unit 3 is a home located in Clayton County with nearby schools including Pointe South Elementary School, Pointe South Middle School, and Mundy's Mill High School.
Ownership History
Date
Name
Owned For
Owner Type
Purchase Details
Closed on
Mar 26, 2019
Sold by
Cpp Properties Llc
Bought by
Cerberus Sfr Holdings Ii Lp
Current Estimated Value
Purchase Details
Closed on
Dec 27, 2018
Sold by
Bumblebee Capital Llc
Bought by
Cpp Properties Llc
Purchase Details
Closed on
Oct 24, 2018
Sold by
Hendrix Neal
Bought by
Real Estate Capital Exchange Llc
Purchase Details
Closed on
Oct 23, 2018
Sold by
Real Estate Capital Exchange Llc
Bought by
Bumblebee Capital Llc
Purchase Details
Closed on
Jul 2, 1996
Sold by
Raposa Mary G
Bought by
Hendrix Neal
Purchase Details
Closed on
Mar 15, 1994
Sold by
Hobart James
Bought by
Raposa Mary G
Home Financials for this Owner
Home Financials are based on the most recent Mortgage that was taken out on this home.
Original Mortgage
$69,546
Interest Rate
9%
Mortgage Type
FHA
Create a Home Valuation Report for This Property
The Home Valuation Report is an in-depth analysis detailing your home's value as well as a comparison with similar homes in the area
Home Values in the Area
Average Home Value in this Area
Purchase History
| Date | Buyer | Sale Price | Title Company |
|---|---|---|---|
| Cerberus Sfr Holdings Ii Lp | $584,547 | -- | |
| Cpp Properties Llc | $91,000 | -- | |
| Real Estate Capital Exchange Llc | $55,000 | -- | |
| Bumblebee Capital Llc | $73,000 | -- | |
| Hendrix Neal | $9,000 | -- | |
| Raposa Mary G | $8,000 | -- |
Source: Public Records
Mortgage History
| Date | Status | Borrower | Loan Amount |
|---|---|---|---|
| Previous Owner | Raposa Mary G | $69,546 | |
| Closed | Raposa Mary G | $2,000 | |
| Closed | Hendrix Neal | $0 |
Source: Public Records
Tax History Compared to Growth
Tax History
| Year | Tax Paid | Tax Assessment Tax Assessment Total Assessment is a certain percentage of the fair market value that is determined by local assessors to be the total taxable value of land and additions on the property. | Land | Improvement |
|---|---|---|---|---|
| 2024 | $2,450 | $62,800 | $8,800 | $54,000 |
| 2023 | $2,267 | $62,800 | $8,800 | $54,000 |
| 2022 | $2,465 | $62,800 | $8,800 | $54,000 |
| 2021 | $1,924 | $48,720 | $8,800 | $39,920 |
| 2020 | $1,572 | $39,299 | $8,800 | $30,499 |
| 2019 | $1,185 | $29,200 | $5,600 | $23,600 |
| 2018 | $1,254 | $30,900 | $5,600 | $25,300 |
| 2017 | $953 | $23,411 | $5,600 | $17,811 |
| 2016 | $927 | $22,780 | $5,600 | $17,180 |
| 2015 | $798 | $0 | $0 | $0 |
| 2014 | $614 | $15,442 | $5,600 | $9,842 |
Source: Public Records
Map
Nearby Homes
- 8882 Habersham Dr
- 8971 Habersham Dr
- 8865 Raven Dr
- 9043 Raven Dr
- 8685 Woodside Ln
- 444 Wellington Way
- 8949 Raven Dr Unit I
- 9103 Raven Dr
- 616 Country Lane Dr
- 8717 Lakeview Commons
- 8684 Lakeview Commons
- 778 Villa Way
- 1065 Brandon Hill Way
- 841 Kenwood Ln
- 1089 Brandon Hill Way
- 8988 Raven Dr
- 638 Wellington Way
- 781 Villa Way
- 1120 Brandon Hill Way
- 634 Post Oak Rd
- 8901 Gardener Dr
- 8885 Gardener Dr
- 8890 Habersham Dr Unit 2
- 8900 Habersham Dr
- 8882 Habersham Dr Unit 2
- 8875 Gardener Dr Unit 3
- 8909 Gardener Dr Unit 3
- 8888 Gardener Dr
- 8908 Habersham Dr Unit 11
- 8904 Gardener Dr Unit 3
- 0 Habersham Dr Unit 8753717
- 0 Habersham Dr Unit 3166473
- 0 Habersham Dr
- 8872 Habersham Dr Unit 2
- 8876 Gardener Dr
- 8867 Gardener Dr
- 8918 Habersham Dr
- 8915 Gardener Dr
- 0 Sumter Ct Unit 8603402
- 8893 Habersham Dr Unit 2