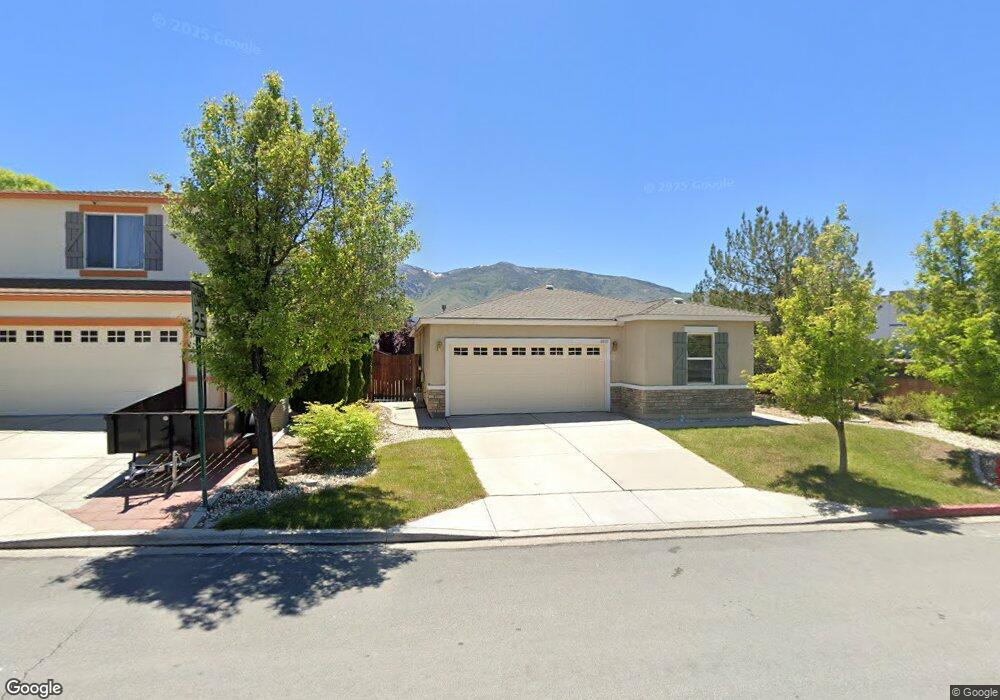
8895 Sunset Breeze Dr Reno, NV 89506
Stead NeighborhoodEstimated Value: $393,441 - $422,000
3
Beds
2
Baths
1,246
Sq Ft
$322/Sq Ft
Est. Value
About This Home
This home is located at 8895 Sunset Breeze Dr, Reno, NV 89506 and is currently estimated at $401,360, approximately $322 per square foot. 8895 Sunset Breeze Dr is a home located in Washoe County with nearby schools including Stokesdale Elementary School, Silver Lake Elementary School, and Glenn C. Marlow Elementary School.
Ownership History
Date
Name
Owned For
Owner Type
Purchase Details
Closed on
Mar 14, 2019
Sold by
Gathercoal Susan
Bought by
Gathercoal Susan M and Susan M Gathercoal 2008 Trust
Current Estimated Value
Purchase Details
Closed on
Nov 7, 2011
Sold by
Federal National Mortgage Association
Bought by
Cathercoal Susan M
Purchase Details
Closed on
Mar 2, 2011
Sold by
Sandstrom Robert C and Sandstrom Pamela
Bought by
Federal National Mortgage Association
Purchase Details
Closed on
Jan 23, 2006
Sold by
Centex Homes
Bought by
Sandstrom Robert C and Sandstrom Pamela
Home Financials for this Owner
Home Financials are based on the most recent Mortgage that was taken out on this home.
Original Mortgage
$200,550
Interest Rate
6.32%
Mortgage Type
Fannie Mae Freddie Mac
Create a Home Valuation Report for This Property
The Home Valuation Report is an in-depth analysis detailing your home's value as well as a comparison with similar homes in the area
Home Values in the Area
Average Home Value in this Area
Purchase History
| Date | Buyer | Sale Price | Title Company |
|---|---|---|---|
| Gathercoal Susan M | -- | None Available | |
| Cathercoal Susan M | $100,000 | Servicelink Irvine | |
| Federal National Mortgage Association | $201,469 | Accommodation | |
| Sandstrom Robert C | $251,000 | Commerce Title |
Source: Public Records
Mortgage History
| Date | Status | Borrower | Loan Amount |
|---|---|---|---|
| Previous Owner | Sandstrom Robert C | $200,550 |
Source: Public Records
Tax History Compared to Growth
Tax History
| Year | Tax Paid | Tax Assessment Tax Assessment Total Assessment is a certain percentage of the fair market value that is determined by local assessors to be the total taxable value of land and additions on the property. | Land | Improvement |
|---|---|---|---|---|
| 2026 | -- | $88,857 | $31,089 | $57,768 |
| 2025 | $1,630 | $89,454 | $30,657 | $58,798 |
| 2024 | $1,630 | $86,642 | $27,531 | $59,112 |
| 2023 | $1,583 | $82,181 | $26,401 | $55,781 |
| 2022 | $1,537 | $69,522 | $23,142 | $46,380 |
| 2021 | $1,493 | $64,091 | $18,121 | $45,970 |
| 2020 | $1,448 | $63,587 | $17,556 | $46,031 |
| 2019 | $1,405 | $61,935 | $17,323 | $44,612 |
| 2018 | $1,238 | $52,315 | $12,269 | $40,046 |
| 2017 | $1,202 | $51,479 | $11,438 | $40,041 |
| 2016 | $1,171 | $51,008 | $10,141 | $40,867 |
| 2015 | $295 | $49,276 | $8,512 | $40,764 |
| 2014 | $1,135 | $41,894 | $6,816 | $35,078 |
| 2013 | -- | $30,023 | $4,988 | $25,035 |
Source: Public Records
Map
Nearby Homes
- 8660 Sunrise Mist Ct
- 8678 Strutter Way
- 8602 Strutter Way
- 8696 Red Baron Blvd
- 7663 Crystal Shores Dr
- 7456 Creekland Dr
- 7497 Hebrides Ct
- 7447 Findhorn Dr
- 7462 Findhorn Dr
- 8486 Piper Place
- 8410 Red Baron Blvd
- 8419 Sopwith Blvd
- 7085 Indigo Cir
- 11642 Green Mountain St
- 12123 Andes St
- 12360 Rocky Mountain St
- 8031 Monterey Shores Dr
- 12190 Rocky Mountain St
- 12322 Rocky Mountain St
- 6995 Peppermint Dr
- 8885 Sunset Breeze Dr
- 8881 Sunset Breeze Dr
- 8898 Sunset Breeze
- 8894 Sunset Breeze Dr
- 8898 Sunset Breeze Dr
- 8877 Sunset Breeze Dr
- 8890 Sunset Breeze Dr
- 8886 Sunset Breeze Dr
- 8873 Sunset Breeze Dr
- 8845 Silver Dawn Ct
- 8882 Sunset Breeze Dr
- 8840 Silver Dawn Ct
- 8975 Silverkist Dr
- 8965 Silverkist Dr
- 8869 Sunset Breeze Dr
- 8955 Silverkist Dr
- 8835 Silver Dawn Ct
- 8878 Sunset Breeze Dr
- 8945 Silverkist Dr
- 8874 Sunset Breeze Dr