
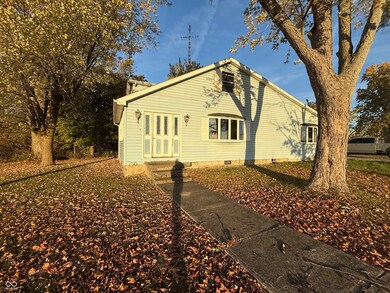
8897 E N 00 S Marion, IN 46952
Estimated payment $1,366/month
Highlights
- 15 Acre Lot
- No HOA
- Entrance Foyer
- Eastbrook High School Rated 9+
- Breakfast Bar
- Forced Air Heating and Cooling System
About This Home
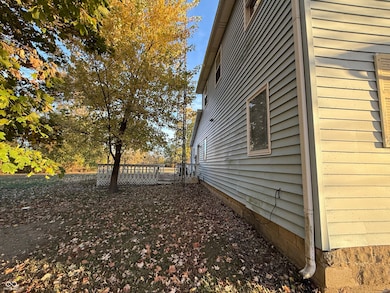
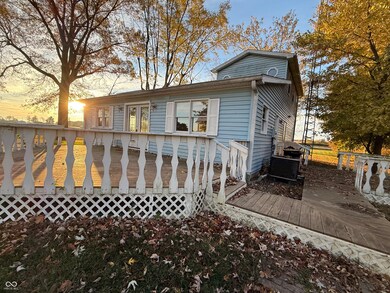
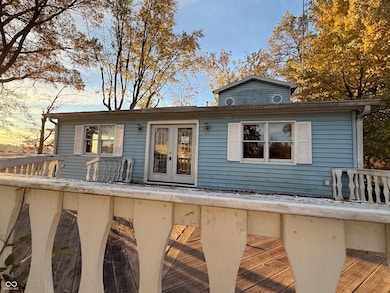
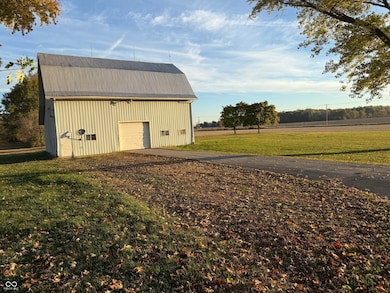
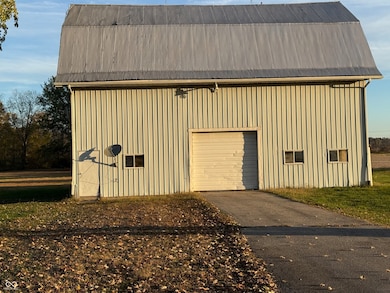
Discover the perfect blend of space and potential with this 4-bedroom, 2.5-bath home offering over 2,200 sq ft of living space, set on an impressive 15-acre property just north of Eastbrook High School. This country setting provides endless opportunities-whether you're looking to start a hobby farm, enjoy outdoor recreation, or simply take in the privacy and views of wide-open land. The home features a generous layout with both living and family areas, and two decks where you can relax and enjoy the surrounding scenery. A large barn adds valuable storage, workspace, or agricultural potential. While the home needs some updates, it provides a solid foundation and the chance to make it your own.
Home Details
Home Type
- Single Family
Est. Annual Taxes
- $1,936
Year Built
- Built in 1914
Home Design
- Wood Siding
Interior Spaces
- 1.5-Story Property
- Entrance Foyer
- Combination Kitchen and Dining Room
- Crawl Space
- Breakfast Bar
Flooring
- Carpet
- Laminate
Bedrooms and Bathrooms
- 4 Bedrooms
Schools
- Eastbrook South Elementary School
- Eastbrook Junior High School
- Eastbrook High School
Additional Features
- 15 Acre Lot
- Forced Air Heating and Cooling System
Community Details
- No Home Owners Association
Listing and Financial Details
- Tax Lot 27-08-04-400-011.000-020
- Assessor Parcel Number 270804400011000020
Map
Home Values in the Area
Average Home Value in this Area
Tax History
| Year | Tax Paid | Tax Assessment Tax Assessment Total Assessment is a certain percentage of the fair market value that is determined by local assessors to be the total taxable value of land and additions on the property. | Land | Improvement |
|---|---|---|---|---|
| 2024 | $1,936 | $169,900 | $49,600 | $120,300 |
| 2023 | $1,714 | $152,200 | $45,200 | $107,000 |
| 2022 | $1,623 | $134,800 | $35,400 | $99,400 |
| 2021 | $1,596 | $123,500 | $33,000 | $90,500 |
| 2020 | $1,434 | $118,200 | $32,000 | $86,200 |
| 2019 | $1,394 | $119,900 | $35,200 | $84,700 |
| 2018 | $1,325 | $117,200 | $35,800 | $81,400 |
| 2017 | $1,328 | $119,200 | $38,600 | $80,600 |
| 2016 | $1,280 | $120,500 | $39,900 | $80,600 |
| 2014 | $1,083 | $110,500 | $41,000 | $69,500 |
| 2013 | $1,083 | $108,100 | $36,600 | $71,500 |
Property History
| Date | Event | Price | List to Sale | Price per Sq Ft |
|---|---|---|---|---|
| 11/10/2025 11/10/25 | Pending | -- | -- | -- |
| 10/30/2025 10/30/25 | For Sale | $229,900 | -- | $105 / Sq Ft |
Purchase History
| Date | Type | Sale Price | Title Company |
|---|---|---|---|
| Sheriffs Deed | $205,670 | None Listed On Document | |
| Warranty Deed | -- | None Available | |
| Warranty Deed | -- | None Available |
Mortgage History
| Date | Status | Loan Amount | Loan Type |
|---|---|---|---|
| Previous Owner | $216,000 | New Conventional |
Source: MIBOR Broker Listing Cooperative®
MLS Number: 22070962
APN: 27-08-04-400-011.000-020
Disclaimer: Certain information contained herein is derived from information provided by parties other than Homes.com. All information provided is deemed reliable, but is not guaranteed to be accurate and should be independently verified.
![]() Based on information submitted to the MLS GRID. All data is obtained from various sources and may not have been verified by broker or MLS GRID. Supplied Open House Information is subject to change without notice. All information should be independently reviewed and verified for accuracy. Properties may or may not be listed by the office/agent presenting the information. Some IDX listings have been excluded from this website.
Based on information submitted to the MLS GRID. All data is obtained from various sources and may not have been verified by broker or MLS GRID. Supplied Open House Information is subject to change without notice. All information should be independently reviewed and verified for accuracy. Properties may or may not be listed by the office/agent presenting the information. Some IDX listings have been excluded from this website.
