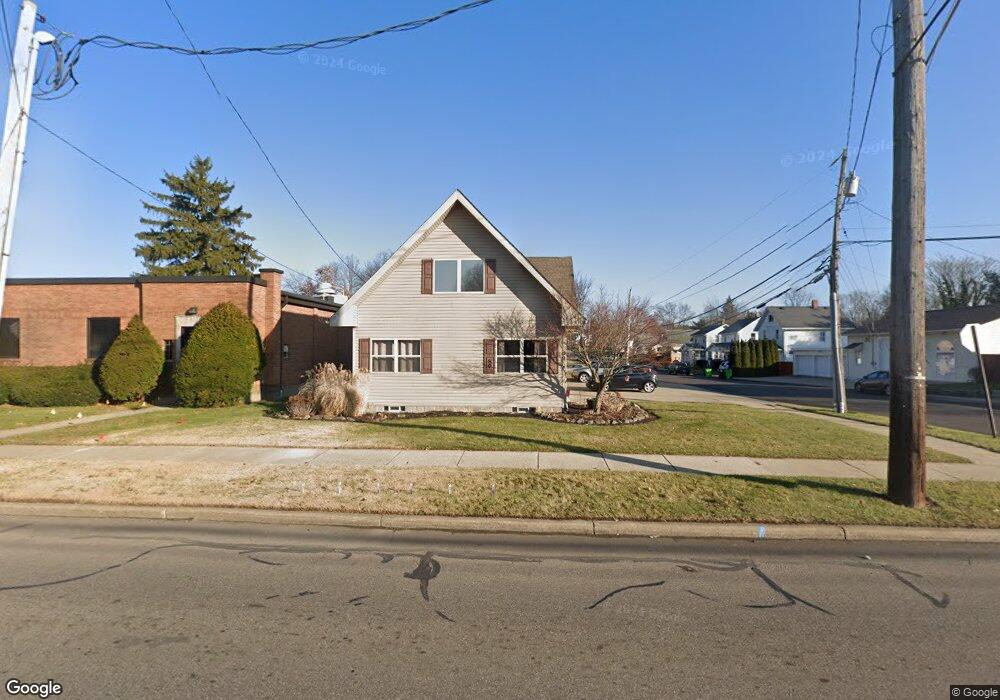
89 31st St SW Barberton, OH 44203
Johnson's Corners NeighborhoodEstimated Value: $201,800 - $237,000
3
Beds
3
Baths
2,602
Sq Ft
$82/Sq Ft
Est. Value
About This Home
This home is located at 89 31st St SW, Barberton, OH 44203 and is currently estimated at $212,950, approximately $81 per square foot. 89 31st St SW is a home located in Summit County with nearby schools including Barberton Middle School, Barberton High School, and Hametown Christian Academy.
Ownership History
Date
Name
Owned For
Owner Type
Purchase Details
Closed on
Aug 28, 2008
Sold by
Messinger Christopher J
Bought by
Vrba Daniel A
Current Estimated Value
Purchase Details
Closed on
May 2, 2008
Sold by
Critchfield Robert M
Bought by
Vrba Daniel A and Messinger Christopher J
Home Financials for this Owner
Home Financials are based on the most recent Mortgage that was taken out on this home.
Original Mortgage
$152,605
Interest Rate
5.88%
Mortgage Type
FHA
Purchase Details
Closed on
Jun 29, 2005
Sold by
Finley Timothy W and Finley Deborah G
Bought by
Critchfield Robert M and The Robert M Critchfield Revocable Trust
Purchase Details
Closed on
May 25, 2004
Sold by
Braucher Robert W and Burkhardt Betty L
Bought by
Finley Timothy W and Finley Deborah G
Create a Home Valuation Report for This Property
The Home Valuation Report is an in-depth analysis detailing your home's value as well as a comparison with similar homes in the area
Home Values in the Area
Average Home Value in this Area
Purchase History
| Date | Buyer | Sale Price | Title Company |
|---|---|---|---|
| Vrba Daniel A | $54,045 | Majestic Title Services Llc | |
| Vrba Daniel A | $155,000 | Lawyers Title Ins | |
| Critchfield Robert M | $17,000 | Bond & Associates Title Agen | |
| Finley Timothy W | $15,000 | Bond & Associates Title Agen |
Source: Public Records
Mortgage History
| Date | Status | Borrower | Loan Amount |
|---|---|---|---|
| Previous Owner | Vrba Daniel A | $152,605 |
Source: Public Records
Tax History Compared to Growth
Tax History
| Year | Tax Paid | Tax Assessment Tax Assessment Total Assessment is a certain percentage of the fair market value that is determined by local assessors to be the total taxable value of land and additions on the property. | Land | Improvement |
|---|---|---|---|---|
| 2025 | $2,961 | $57,674 | $10,077 | $47,597 |
| 2024 | $2,961 | $57,674 | $10,077 | $47,597 |
| 2023 | $2,961 | $57,674 | $10,077 | $47,597 |
| 2022 | $2,492 | $42,098 | $7,357 | $34,741 |
| 2021 | $2,489 | $42,098 | $7,357 | $34,741 |
| 2020 | $2,437 | $42,100 | $7,360 | $34,740 |
| 2019 | $2,146 | $33,580 | $6,990 | $26,590 |
| 2018 | $2,114 | $33,580 | $6,990 | $26,590 |
| 2017 | $2,142 | $33,580 | $6,990 | $26,590 |
| 2016 | $2,147 | $33,580 | $6,990 | $26,590 |
| 2015 | $2,142 | $33,580 | $6,990 | $26,590 |
| 2014 | $2,131 | $33,580 | $6,990 | $26,590 |
| 2013 | $2,073 | $33,860 | $6,990 | $26,870 |
Source: Public Records
Map
Nearby Homes
- V/L Benton
- 1361 Prospect St
- 32 29th St SW
- 1450 Wooster Rd W
- 100 Meadow Ct
- 21 29th St SW
- 1364 Wooster Rd W
- 1253 Prospect St
- 1278 Noble St
- 207 28th St SW
- 000 Haynes Ave
- 1536 Wayne St
- 4568 Krancz Dr
- 1125 Prospect St
- 3492 Johnson Rd
- 38 24th St NW
- 1084 Wooster Rd W
- 5300 S Cleveland Massillon Rd
- 1030 Stratford St
- 1430 Harden Dr