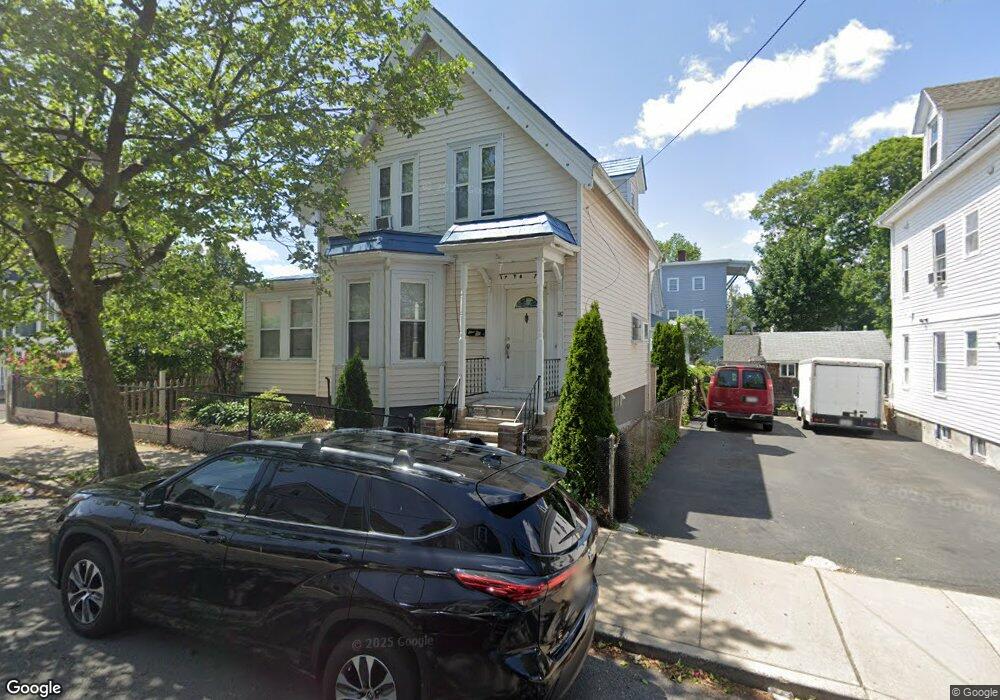
89 Adams St Lynn, MA 01902
Highlands NeighborhoodEstimated Value: $496,887 - $554,000
3
Beds
1
Bath
1,360
Sq Ft
$381/Sq Ft
Est. Value
About This Home
This home is located at 89 Adams St, Lynn, MA 01902 and is currently estimated at $517,972, approximately $380 per square foot. 89 Adams St is a home located in Essex County with nearby schools including Robert L. Ford Elementary School, William R. Fallon School, and Marshall Middle School.
Ownership History
Date
Name
Owned For
Owner Type
Purchase Details
Closed on
Jan 14, 2005
Sold by
Moore James and Carr-Winocour Valerie
Bought by
Rodriquez Jesus and Portillo Gladis
Current Estimated Value
Purchase Details
Closed on
Jul 7, 1995
Sold by
Est Coleman Margaret and Coleman Helen B
Bought by
Stone Grover C
Create a Home Valuation Report for This Property
The Home Valuation Report is an in-depth analysis detailing your home's value as well as a comparison with similar homes in the area
Home Values in the Area
Average Home Value in this Area
Purchase History
| Date | Buyer | Sale Price | Title Company |
|---|---|---|---|
| Rodriquez Jesus | $221,000 | -- | |
| Rodriquez Jesus | $221,000 | -- | |
| Stone Grover C | $70,000 | -- | |
| Stone Grover C | $70,000 | -- |
Source: Public Records
Mortgage History
| Date | Status | Borrower | Loan Amount |
|---|---|---|---|
| Open | Stone Grover C | $278,038 | |
| Closed | Stone Grover C | $248,000 |
Source: Public Records
Tax History
| Year | Tax Paid | Tax Assessment Tax Assessment Total Assessment is a certain percentage of the fair market value that is determined by local assessors to be the total taxable value of land and additions on the property. | Land | Improvement |
|---|---|---|---|---|
| 2025 | $5,033 | $485,800 | $195,400 | $290,400 |
| 2024 | $4,751 | $451,200 | $176,400 | $274,800 |
| 2023 | $4,657 | $417,700 | $176,400 | $241,300 |
| 2022 | $4,482 | $360,600 | $144,200 | $216,400 |
| 2021 | $4,349 | $333,800 | $131,500 | $202,300 |
| 2020 | $3,822 | $285,200 | $102,800 | $182,400 |
| 2019 | $3,890 | $272,000 | $100,200 | $171,800 |
| 2018 | $3,647 | $240,700 | $96,800 | $143,900 |
| 2017 | $3,345 | $214,400 | $75,300 | $139,100 |
| 2016 | $3,152 | $194,800 | $63,400 | $131,400 |
| 2015 | $3,064 | $182,900 | $68,100 | $114,800 |
Source: Public Records
Map
Nearby Homes
Your Personal Tour Guide
Ask me questions while you tour the home.