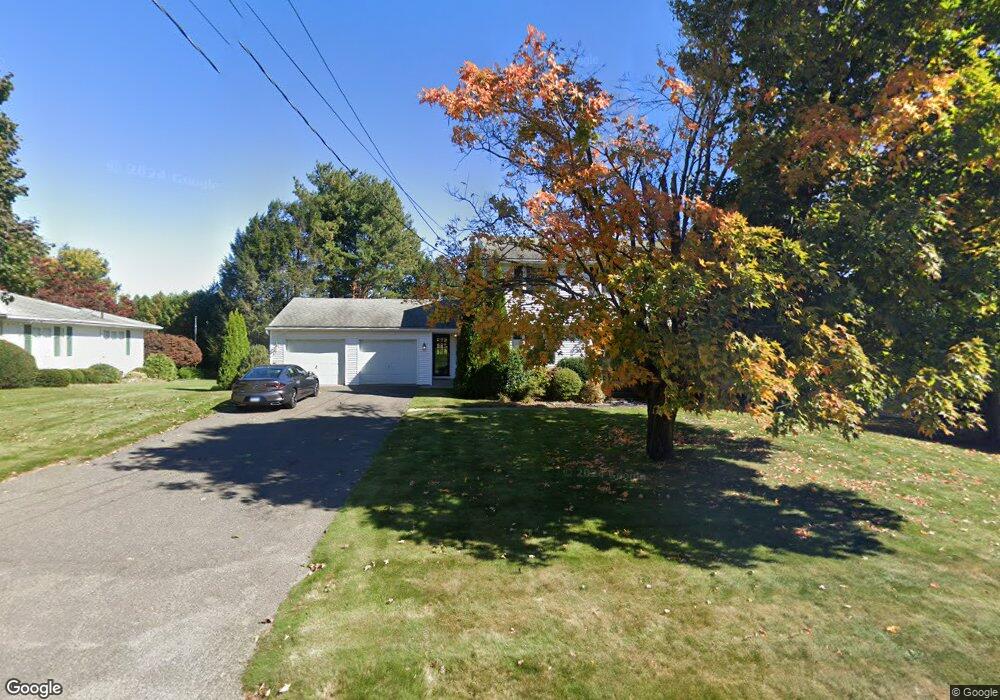
89 Baldwin Dr Bristol, CT 06010
North Bristol NeighborhoodEstimated Value: $429,512 - $482,000
4
Beds
2
Baths
1,882
Sq Ft
$246/Sq Ft
Est. Value
About This Home
This home is located at 89 Baldwin Dr, Bristol, CT 06010 and is currently estimated at $462,878, approximately $245 per square foot. 89 Baldwin Dr is a home located in Hartford County with nearby schools including West Bristol Sch, Bristol Central High School, and St. Joseph School.
Ownership History
Date
Name
Owned For
Owner Type
Purchase Details
Closed on
Feb 24, 2005
Sold by
Oconnell Arthur V Est
Bought by
Beauchemin Christopher C and Beauchemin Carrie E
Current Estimated Value
Home Financials for this Owner
Home Financials are based on the most recent Mortgage that was taken out on this home.
Original Mortgage
$206,500
Outstanding Balance
$102,184
Interest Rate
5.25%
Estimated Equity
$360,694
Create a Home Valuation Report for This Property
The Home Valuation Report is an in-depth analysis detailing your home's value as well as a comparison with similar homes in the area
Home Values in the Area
Average Home Value in this Area
Purchase History
| Date | Buyer | Sale Price | Title Company |
|---|---|---|---|
| Beauchemin Christopher C | $270,000 | -- |
Source: Public Records
Mortgage History
| Date | Status | Borrower | Loan Amount |
|---|---|---|---|
| Open | Beauchemin Christopher C | $206,500 |
Source: Public Records
Tax History
| Year | Tax Paid | Tax Assessment Tax Assessment Total Assessment is a certain percentage of the fair market value that is determined by local assessors to be the total taxable value of land and additions on the property. | Land | Improvement |
|---|---|---|---|---|
| 2025 | $7,539 | $223,370 | $52,010 | $171,360 |
| 2024 | $7,380 | $231,700 | $52,010 | $179,690 |
| 2023 | $7,032 | $231,700 | $52,010 | $179,690 |
| 2022 | $6,255 | $163,100 | $40,670 | $122,430 |
| 2021 | $6,255 | $163,100 | $40,670 | $122,430 |
| 2020 | $6,255 | $163,100 | $40,670 | $122,430 |
| 2019 | $6,206 | $163,100 | $40,670 | $122,430 |
| 2018 | $6,015 | $163,100 | $40,670 | $122,430 |
| 2017 | $5,793 | $160,790 | $55,300 | $105,490 |
| 2016 | $5,793 | $160,790 | $55,300 | $105,490 |
| 2015 | $5,565 | $160,790 | $55,300 | $105,490 |
| 2014 | $5,565 | $160,790 | $55,300 | $105,490 |
Source: Public Records
Map
Nearby Homes
- 0 Hart St Unit 170255530
- 38 Eastwood Rd
- 62 (Lot 13-1) James P Casey Rd
- 209 Ashley Rd
- 454 Maple Ave
- 83 Lardner Rd
- 35 Lardner Rd
- 19 Woodside Way
- 439 James P Casey Rd
- 380 Burlington Ave
- 354 Maple Ave
- 35 James P Casey Rd
- 4 Southdown Dr
- 40 Matthews St Unit 30
- 68 Hart St
- 0 Fairlawn St
- 22 Ingraham St
- 15 Bittersweet Ln
- 1 Hickory St
- 135 Jerome Ave
Your Personal Tour Guide
Ask me questions while you tour the home.