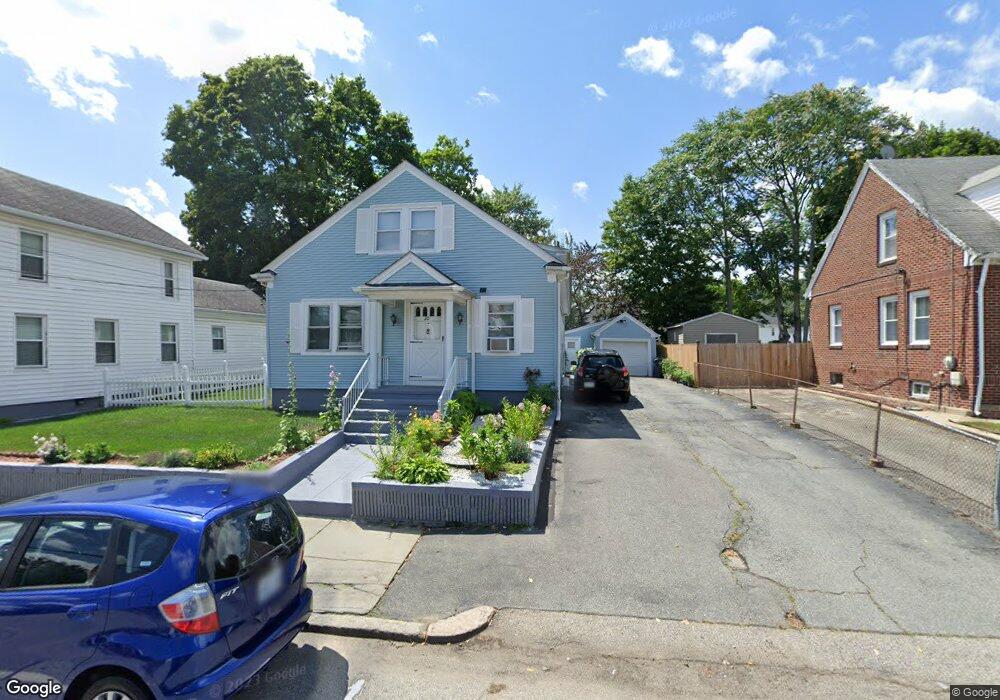
89 Bowlet St Providence, RI 02909
Hartford NeighborhoodEstimated Value: $369,012 - $398,000
4
Beds
1
Bath
1,600
Sq Ft
$240/Sq Ft
Est. Value
About This Home
This home is located at 89 Bowlet St, Providence, RI 02909 and is currently estimated at $383,253, approximately $239 per square foot. 89 Bowlet St is a home located in Providence County with nearby schools including Achievement First Promesa, Achievement First Providence Mayoral Academy Elementary School, and Achievement First Providence Mayoral Academy Elementary.
Ownership History
Date
Name
Owned For
Owner Type
Purchase Details
Closed on
Mar 31, 2003
Sold by
Tang Robin R
Bought by
Cabrera Orlando V and Arroyo Carmen M
Current Estimated Value
Home Financials for this Owner
Home Financials are based on the most recent Mortgage that was taken out on this home.
Original Mortgage
$128,250
Outstanding Balance
$53,283
Interest Rate
5.91%
Estimated Equity
$329,970
Purchase Details
Closed on
Jun 30, 2000
Sold by
Amore Anthony M and Amore Judith A
Bought by
Tang Robin R
Home Financials for this Owner
Home Financials are based on the most recent Mortgage that was taken out on this home.
Original Mortgage
$78,623
Interest Rate
8.59%
Create a Home Valuation Report for This Property
The Home Valuation Report is an in-depth analysis detailing your home's value as well as a comparison with similar homes in the area
Home Values in the Area
Average Home Value in this Area
Purchase History
| Date | Buyer | Sale Price | Title Company |
|---|---|---|---|
| Cabrera Orlando V | $135,000 | -- | |
| Tang Robin R | $92,500 | -- |
Source: Public Records
Mortgage History
| Date | Status | Borrower | Loan Amount |
|---|---|---|---|
| Open | Tang Robin R | $128,250 | |
| Previous Owner | Tang Robin R | $78,623 | |
| Previous Owner | Tang Robin R | $70,461 | |
| Closed | Tang Robin R | $2,500 |
Source: Public Records
Tax History
| Year | Tax Paid | Tax Assessment Tax Assessment Total Assessment is a certain percentage of the fair market value that is determined by local assessors to be the total taxable value of land and additions on the property. | Land | Improvement |
|---|---|---|---|---|
| 2025 | $2,857 | $340,100 | $136,800 | $203,300 |
| 2024 | $4,644 | $253,100 | $86,500 | $166,600 |
| 2023 | $4,644 | $253,100 | $86,500 | $166,600 |
| 2022 | $4,505 | $253,100 | $86,500 | $166,600 |
| 2021 | $3,962 | $161,300 | $50,100 | $111,200 |
| 2020 | $3,962 | $161,300 | $50,100 | $111,200 |
| 2019 | $3,962 | $161,300 | $50,100 | $111,200 |
| 2018 | $4,273 | $133,700 | $42,700 | $91,000 |
| 2017 | $4,273 | $133,700 | $42,700 | $91,000 |
| 2016 | $4,273 | $133,700 | $42,700 | $91,000 |
| 2015 | $4,012 | $121,200 | $42,700 | $78,500 |
| 2014 | $4,091 | $121,200 | $42,700 | $78,500 |
| 2013 | $4,091 | $121,200 | $42,700 | $78,500 |
Source: Public Records
Map
Nearby Homes
Your Personal Tour Guide
Ask me questions while you tour the home.