
Estimated payment $693/month
Highlights
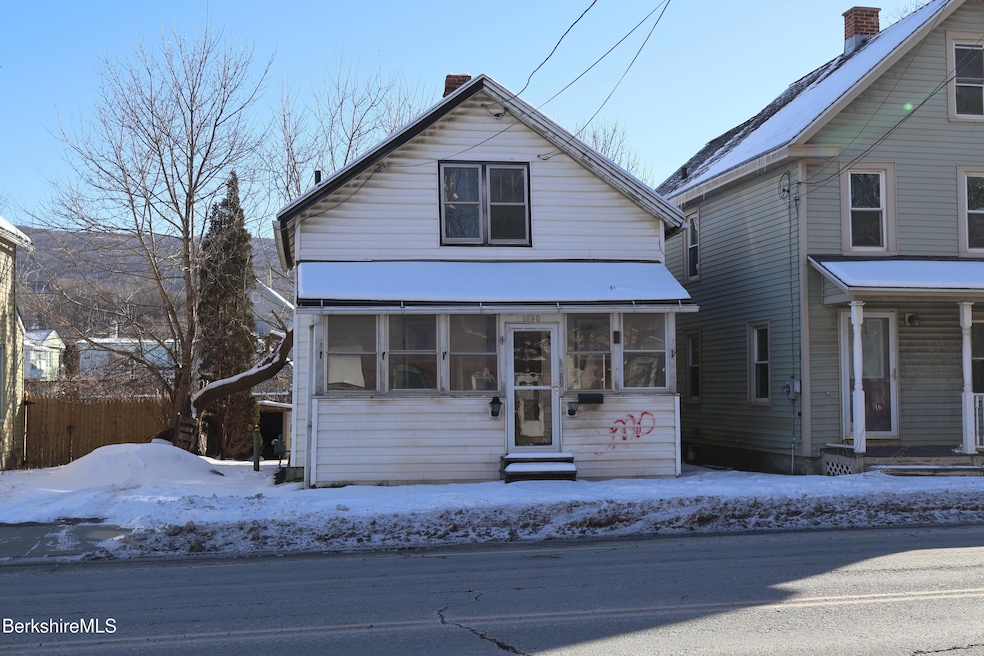
- Cape Cod Architecture
- Hot Water Heating System
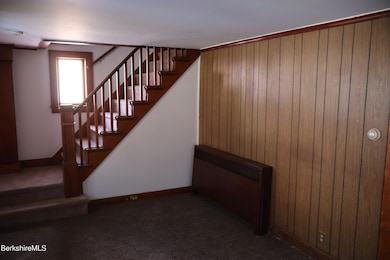
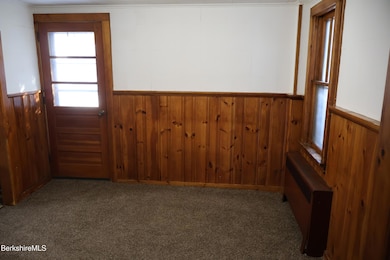
- Carpet
About This Home
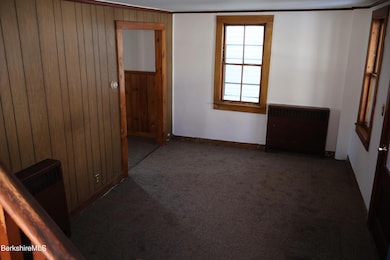
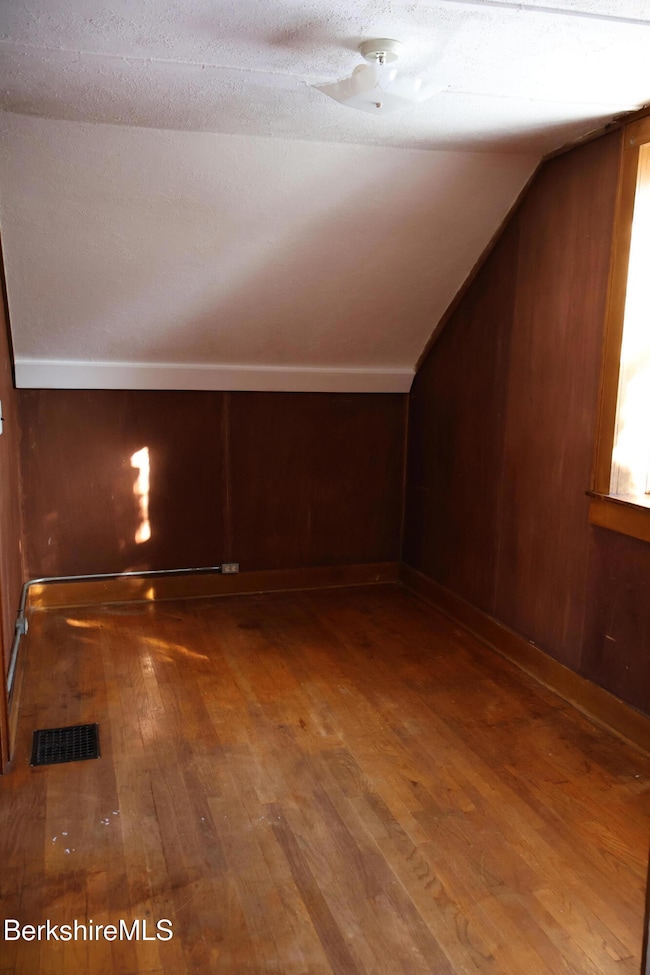
Cute 2 bed, 1 bath home in the heart of Adams! Newer boiler and hot water heater. Walking distance to downtown and low maintenance yard!
Listing Agent
GREYLOCK REALTY, LLC. Brokerage Email: Erik@GreylockRealty.com License #009512678 Listed on: 12/08/2025
Home Details
Home Type
- Single Family
Est. Annual Taxes
- $1,398
Year Built
- 1850
Lot Details
- 1,307 Sq Ft Lot
Home Design
- 700 Sq Ft Home
- Cape Cod Architecture
- Wood Frame Construction
- Asphalt Shingled Roof
- Fiberglass Roof
- Vinyl Siding
Flooring
- Carpet
- Linoleum
Bedrooms and Bathrooms
- 2 Bedrooms
- 1 Full Bathroom
Basement
- Basement Fills Entire Space Under The House
- Interior Basement Entry
Parking
- No Garage
- Off-Street Parking
Schools
- Hoosac Valley Elementary School
- Hoosac Valley Middle & High School
Utilities
- Hot Water Heating System
- Heating System Uses Natural Gas
- Electric Water Heater
Map
Home Values in the Area
Average Home Value in this Area
Tax History
| Year | Tax Paid | Tax Assessment Tax Assessment Total Assessment is a certain percentage of the fair market value that is determined by local assessors to be the total taxable value of land and additions on the property. | Land | Improvement |
|---|---|---|---|---|
| 2025 | $1,398 | $82,200 | $11,200 | $71,000 |
| 2024 | $1,312 | $74,800 | $10,500 | $64,300 |
| 2023 | $1,222 | $65,900 | $9,700 | $56,200 |
| 2022 | $1,189 | $56,900 | $8,400 | $48,500 |
| 2021 | $1,147 | $50,700 | $8,400 | $42,300 |
| 2020 | $1,098 | $50,200 | $8,600 | $41,600 |
| 2019 | $1,074 | $50,200 | $8,600 | $41,600 |
| 2018 | $1,097 | $49,400 | $8,600 | $40,800 |
| 2017 | $1,056 | $49,400 | $8,600 | $40,800 |
| 2016 | $1,007 | $47,100 | $8,600 | $38,500 |
| 2015 | $977 | $45,700 | $9,100 | $36,600 |
| 2014 | $912 | $45,700 | $9,100 | $36,600 |
Property History
| Date | Event | Price | List to Sale | Price per Sq Ft |
|---|---|---|---|---|
| 12/08/2025 12/08/25 | For Sale | $109,900 | -- | $157 / Sq Ft |
Purchase History
| Date | Type | Sale Price | Title Company |
|---|---|---|---|
| Quit Claim Deed | -- | -- | |
| Deed | -- | -- | |
| Deed | -- | -- | |
| Deed | $52,000 | -- | |
| Deed | $48,000 | -- |
Mortgage History
| Date | Status | Loan Amount | Loan Type |
|---|---|---|---|
| Previous Owner | $47,000 | Purchase Money Mortgage | |
| Previous Owner | $38,000 | Purchase Money Mortgage |
Source: Berkshire County Board of REALTORS®
MLS Number: 248396
APN: ADAM-000109-000000-000120
Disclaimer: Certain information contained herein is derived from information provided by parties other than Homes.com. All information provided is deemed reliable, but is not guaranteed to be accurate and should be independently verified.
![]() IDX information is provided exclusively for consumers' personal, non-commercial use, that it may not be used for any purpose other than to identify prospective properties consumers may be interested in purchasing. Information deemed to be reliable but not guaranteed.
IDX information is provided exclusively for consumers' personal, non-commercial use, that it may not be used for any purpose other than to identify prospective properties consumers may be interested in purchasing. Information deemed to be reliable but not guaranteed.
The data relating to real estate for sale on this website comes from Berkshire County Board of Realtors and the Broker Reciprocity Program.
Copyright 2025 Berkshire County Board of Realtors. All rights reserved.
- 185 Columbia St
- 9 Grove St
- 21 Blackinton St
- 278 E Main St Unit 2
- 85 Main Suite 202 St
- 85 Main St
- 520 State Rd Unit 203
- 520 State Rd Unit 202
- 520 State Rd Unit 205
- 106 Church St
- 80 Church St
- 156 River Rd
- 173 Water St
- 1087 N Hoosac Rd
- 19 Williamstown Rd
- 3 Ecology Dr Unit 3
- 1404 North St
- 160 Main St Unit 2
- 21 Downing III
- 17 Taconic Park Dr
