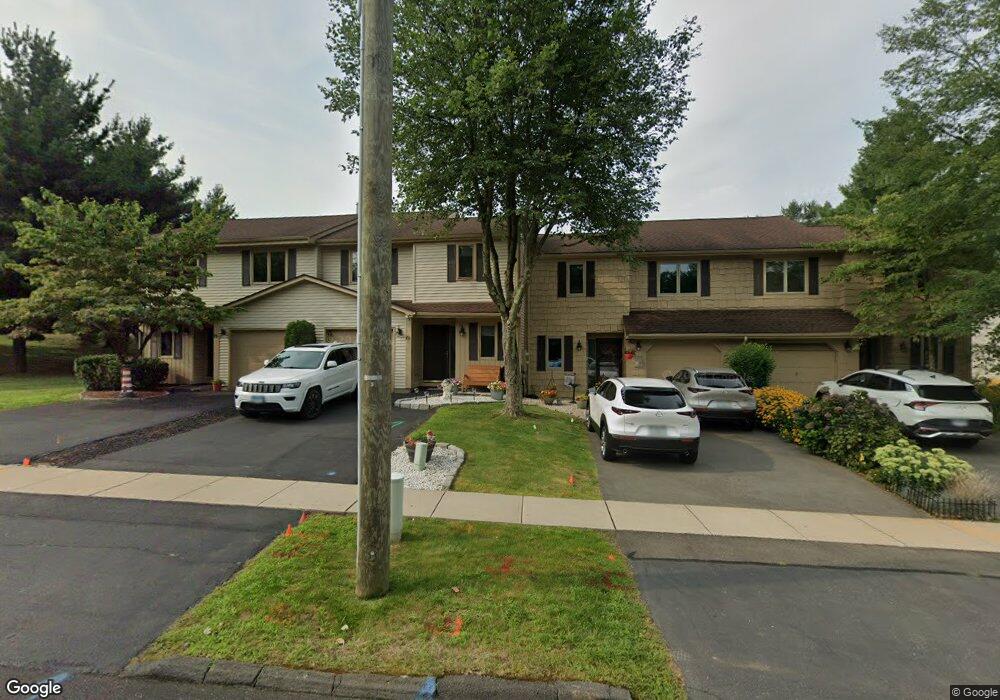
89 Cortland Way Newington, CT 06111
Estimated Value: $306,000 - $332,518
2
Beds
3
Baths
1,344
Sq Ft
$239/Sq Ft
Est. Value
About This Home
This home is located at 89 Cortland Way, Newington, CT 06111 and is currently estimated at $321,130, approximately $238 per square foot. 89 Cortland Way is a home located in Hartford County with nearby schools including Ruth Chaffee School, John Wallace Middle School, and Newington High School.
Ownership History
Date
Name
Owned For
Owner Type
Purchase Details
Closed on
Nov 24, 2015
Sold by
Department Of Housing & Urban Dev
Bought by
Lenares Nicholas
Current Estimated Value
Purchase Details
Closed on
Apr 28, 2015
Sold by
Ocwen Loan Servicing L
Bought by
Department Of Housing & Urban Dev
Purchase Details
Closed on
Jan 20, 2015
Sold by
Goncalves Maria C and Ocwen Loan Servicing L
Bought by
Ocwen Loan Servicing L
Purchase Details
Closed on
Nov 26, 2007
Sold by
Fiore Melinda E
Bought by
Goncalves Maria C
Purchase Details
Closed on
Jul 23, 1997
Sold by
Kerrick Charles and Kerrick Brenda
Bought by
Petronella Joseph
Create a Home Valuation Report for This Property
The Home Valuation Report is an in-depth analysis detailing your home's value as well as a comparison with similar homes in the area
Home Values in the Area
Average Home Value in this Area
Purchase History
| Date | Buyer | Sale Price | Title Company |
|---|---|---|---|
| Lenares Nicholas | $128,200 | -- | |
| Lenares Nicholas | $128,200 | -- | |
| Department Of Housing & Urban Dev | -- | -- | |
| Department Of Housing & Urban Dev | -- | -- | |
| Ocwen Loan Servicing L | -- | -- | |
| Ocwen Loan Servicing L | -- | -- | |
| Goncalves Maria C | $225,000 | -- | |
| Goncalves Maria C | $225,000 | -- | |
| Petronella Joseph | $143,500 | -- | |
| Petronella Joseph | $143,500 | -- |
Source: Public Records
Mortgage History
| Date | Status | Borrower | Loan Amount |
|---|---|---|---|
| Open | Petronella Joseph | $115,000 | |
| Closed | Petronella Joseph | $128,000 |
Source: Public Records
Tax History Compared to Growth
Tax History
| Year | Tax Paid | Tax Assessment Tax Assessment Total Assessment is a certain percentage of the fair market value that is determined by local assessors to be the total taxable value of land and additions on the property. | Land | Improvement |
|---|---|---|---|---|
| 2025 | $5,466 | $136,710 | $0 | $136,710 |
| 2024 | $5,423 | $136,710 | $0 | $136,710 |
| 2023 | $5,244 | $136,710 | $0 | $136,710 |
| 2022 | $5,262 | $136,710 | $0 | $136,710 |
| 2021 | $5,306 | $136,710 | $0 | $136,710 |
| 2020 | $5,526 | $140,680 | $0 | $140,680 |
| 2019 | $5,550 | $140,680 | $0 | $140,680 |
| 2018 | $5,416 | $140,680 | $0 | $140,680 |
| 2017 | $5,147 | $140,680 | $0 | $140,680 |
| 2016 | $5,029 | $140,680 | $0 | $140,680 |
| 2015 | $5,097 | $142,380 | $0 | $142,380 |
| 2014 | -- | $142,380 | $0 | $142,380 |
Source: Public Records
Map
Nearby Homes
- 78 Apple Hill
- 9 Coachmen Ln
- 53 Salem Dr
- 19 Sunnybrook Dr
- 2990 Berlin Turnpike
- 2950 Berlin Turnpike
- 24 Pine Meadow Rd
- 18 Stone Hill Dr
- 43 Steeplechase Dr Unit 43
- 221 Westmeadow Rd
- 31 Woodsedge Dr Unit 1C
- 120 Fox Run Ct
- 35 Woodsedge Dr Unit 4C
- 107 Fox Run Ct Unit 107
- 15 Woodsedge Dr Unit 6C
- 263 Two Rod Hwy
- 31 Fox Run Ct Unit 31
- 660/674 Church Rear St
- 39 Pepper Bush Ln
- 98 Crown Ridge
- 89 Cortland Way Unit 89
- 87 Cortland Way
- 93 Cortland Way
- 85 Cortland Way
- 81 Cortland Way
- 81 Cortland Way Unit 81
- 79 Cortland Way
- 80 Apple Hill
- 80 Apple Hill Unit 80
- 77 Cortland Way
- 76 Apple Hill
- 73 Cortland Way
- 104 Apple Hill
- 74 Apple Hill
- 69 Cortland Way
- 110 Apple Hill
- 72 Apple Hill
- 72 Apple Hill
- 65 Cortland Way