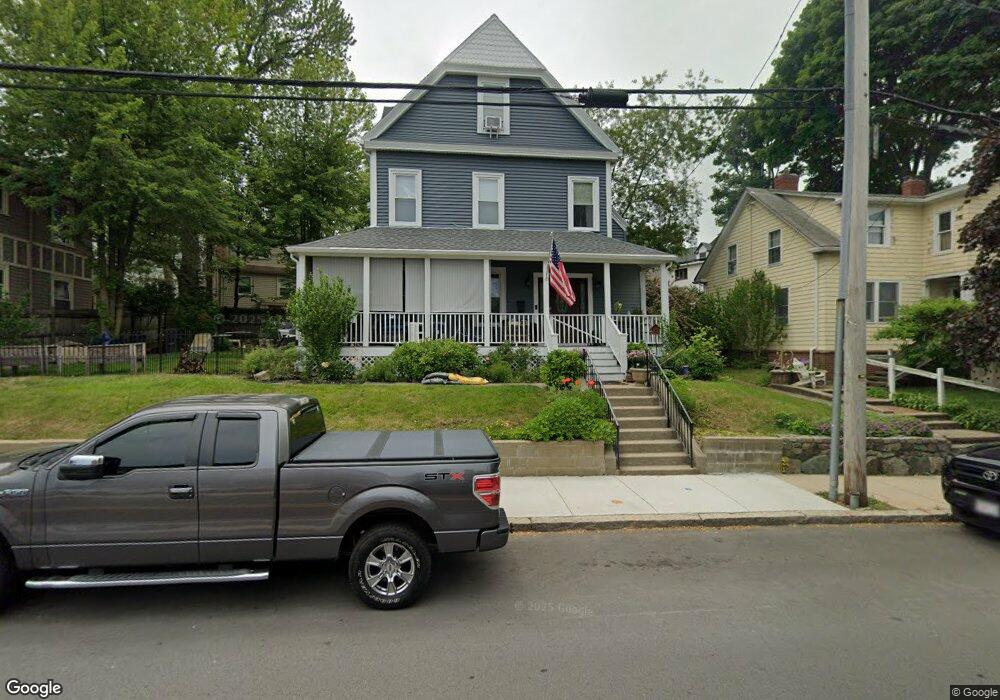
89 Crest Ave Winthrop, MA 02152
Downtown Winthrop NeighborhoodEstimated Value: $756,947 - $883,000
About This Home
This home is located at 89 Crest Ave, Winthrop, MA 02152 and is currently estimated at $813,987, approximately $334 per square foot. 89 Crest Ave is a home located in Suffolk County with nearby schools including William P. Gorman/Fort Banks Elementary School, Arthur T. Cummings Elementary School, and Winthrop Middle School.
Ownership History
We collect this data history from publicly available records. To have your information removed, we recommend requesting removal directly through your county’s website.
Purchase Details
Purchase Details
Purchase Details
Purchase Details
Home Values in the Area
Average Home Value in this Area
Purchase History
We collect this data history from publicly available records. To have your information removed, we recommend requesting removal directly through your county’s website.
| Date | Buyer | Sale Price | Title Company |
|---|---|---|---|
| $175,000 | -- | ||
| $4,000 | -- | ||
| $10,000 | -- | ||
| $136,000 | -- |
Mortgage History
We collect this data history from publicly available records. To have your information removed, we recommend requesting removal directly through your county’s website.
| Date | Status | Borrower | Loan Amount |
|---|---|---|---|
| Open | $250,000 | ||
| Closed | $235,000 |
Tax History
We collect this data history from publicly available records. To have your information removed, we recommend requesting removal directly through your county’s website.
| Year | Tax Paid | Tax Assessment Tax Assessment Total Assessment is a certain percentage of the fair market value that is determined by local assessors to be the total taxable value of land and additions on the property. | Land | Improvement |
|---|---|---|---|---|
| 2025 | $7,107 | $688,700 | $330,600 | $358,100 |
| 2024 | $6,703 | $643,300 | $317,700 | $325,600 |
| 2023 | $6,918 | $646,500 | $290,800 | $355,700 |
| 2022 | $6,807 | $578,800 | $259,800 | $319,000 |
| 2021 | $6,649 | $524,400 | $231,900 | $292,500 |
| 2020 | $6,489 | $514,200 | $231,900 | $282,300 |
| 2019 | $6,376 | $483,800 | $213,700 | $270,100 |
| 2018 | $6,192 | $437,300 | $183,500 | $253,800 |
| 2017 | $5,646 | $391,800 | $162,500 | $229,300 |
| 2016 | $5,352 | $348,200 | $141,300 | $206,900 |
| 2015 | $4,758 | $331,800 | $137,200 | $194,600 |
| 2014 | $4,607 | $295,700 | $127,600 | $168,100 |
Map
- 43 Sagamore Ave Unit 1
- 30 Hutchinson St
- 21 Hutchinson St Unit 1
- 47 Highland Ave
- 23 Sagamore Ave
- 153 Locust St
- 117 Revere St
- 140 Shirley St Unit 230
- 140 Shirley St Unit 210
- 10 Beach Rd Unit 1
- 26 Shirley St Unit B
- 173 Shirley St Unit 2
- 189 Shirley St Unit 1
- 300 Governors Dr Unit 21
- 800 Governors Dr Unit 6
- 1000 Governors Dr Unit 4
- 3 Seal Harbor Rd Unit 632
- 3 Seal Harbor Rd Unit 342
- 52 Trident Ave Unit 52
- 89R Upland Rd
- 90 Sagamore Ave
- 90 Sagamore Ave Unit 2
- 90 Sagamore Ave Unit 1
- 100 Sagamore Ave
- 86 Sagamore Ave
- 86 Sagamore Ave Unit 2
- 85 Crest Ave
- 75 Crest Ave
- 75 Crest Ave Unit 2
- 63 Crest Ave
- 63 Crest Ave Unit 1
- 102 Sagamore Ave
- 89 Sagamore Ave Unit 91
- 91 Sagamore Ave
- 80 Sagamore Ave
- 57 Hutchinson St
- 85 Sagamore Ave
- 95 Sagamore Ave
- 76 Sagamore Ave
- 76 Sagamore Ave Unit 2
Ask me questions while you tour the home.