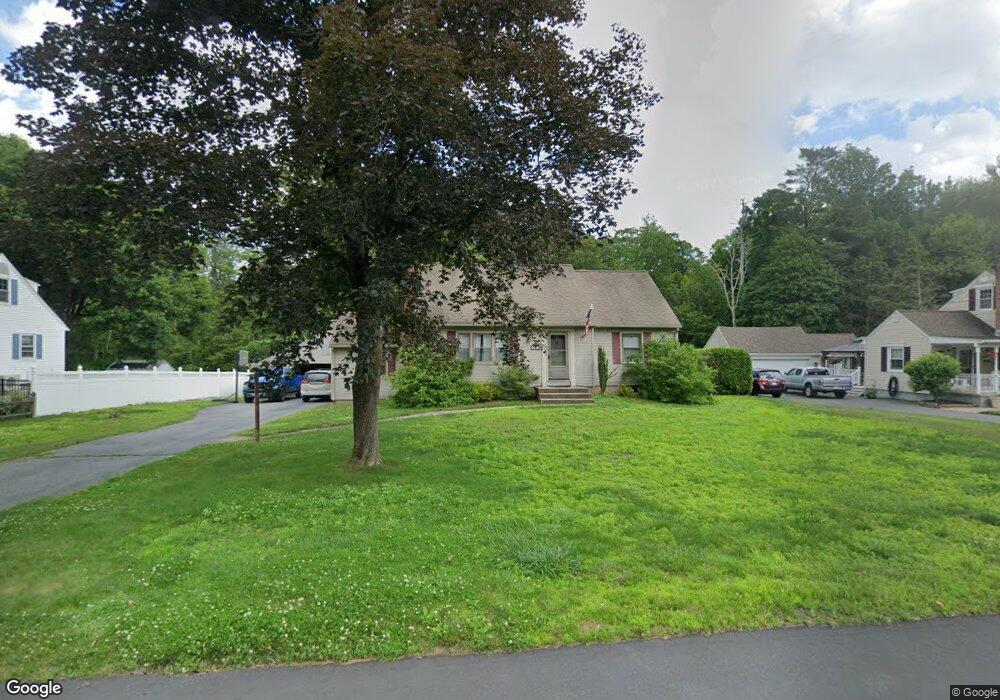
89 E Circle Dr East Longmeadow, MA 01028
Estimated Value: $446,746 - $468,000
4
Beds
2
Baths
2,018
Sq Ft
$227/Sq Ft
Est. Value
About This Home
This home is located at 89 E Circle Dr, East Longmeadow, MA 01028 and is currently estimated at $457,187, approximately $226 per square foot. 89 E Circle Dr is a home located in Hampden County with nearby schools including Meadowbrook Elementary School, Birchland Park Middle School, and East Longmeadow High School.
Ownership History
Date
Name
Owned For
Owner Type
Purchase Details
Closed on
Jun 17, 2008
Sold by
Atkins Kenneth P and Atkins Stacey L
Bought by
Phelan Timothy F and Phelan Kathryn M
Current Estimated Value
Home Financials for this Owner
Home Financials are based on the most recent Mortgage that was taken out on this home.
Original Mortgage
$277,643
Interest Rate
6.13%
Mortgage Type
Purchase Money Mortgage
Purchase Details
Closed on
Dec 29, 2000
Sold by
Carlisle Richard R Est and Carlisle
Bought by
Atkins Stacey L and Atkins Kenneth P
Create a Home Valuation Report for This Property
The Home Valuation Report is an in-depth analysis detailing your home's value as well as a comparison with similar homes in the area
Home Values in the Area
Average Home Value in this Area
Purchase History
| Date | Buyer | Sale Price | Title Company |
|---|---|---|---|
| Phelan Timothy F | $282,000 | -- | |
| Atkins Stacey L | $150,000 | -- |
Source: Public Records
Mortgage History
| Date | Status | Borrower | Loan Amount |
|---|---|---|---|
| Open | Atkins Stacey L | $281,807 | |
| Closed | Phelan Timothy F | $277,643 | |
| Previous Owner | Atkins Stacey L | $145,000 |
Source: Public Records
Tax History Compared to Growth
Tax History
| Year | Tax Paid | Tax Assessment Tax Assessment Total Assessment is a certain percentage of the fair market value that is determined by local assessors to be the total taxable value of land and additions on the property. | Land | Improvement |
|---|---|---|---|---|
| 2025 | $7,303 | $395,200 | $137,100 | $258,100 |
| 2024 | $6,991 | $377,100 | $137,100 | $240,000 |
| 2023 | $6,609 | $344,200 | $124,700 | $219,500 |
| 2022 | $6,278 | $309,400 | $112,500 | $196,900 |
| 2021 | $6,183 | $293,600 | $104,100 | $189,500 |
| 2020 | $5,933 | $284,700 | $104,100 | $180,600 |
| 2019 | $5,696 | $277,200 | $101,100 | $176,100 |
| 2018 | $5,394 | $265,400 | $101,100 | $164,300 |
| 2017 | $5,359 | $258,000 | $99,000 | $159,000 |
| 2016 | $5,348 | $253,200 | $95,700 | $157,500 |
| 2015 | $5,246 | $253,200 | $95,700 | $157,500 |
Source: Public Records
Map
Nearby Homes
- 0 Apple Blossom Ln
- 15 Lynwood Rd
- 399 Elm St
- 123 Mountainview Rd
- 32 Lindsay Rd
- 41 Kerry Dr
- 331 Newhouse St
- 84 Hanward Hill
- 41 Hillside Dr
- 111 Malibu Dr
- 17 Skyridge Ln
- 19 Westminster St
- 12 Poplar St
- 75 Marci Ave
- 72 Tanglewood Dr
- 82 Louis Rd
- 84 Brookhaven Dr
- 1815 Parker St
- 19 Fairview St
- 98 Brookhaven Dr