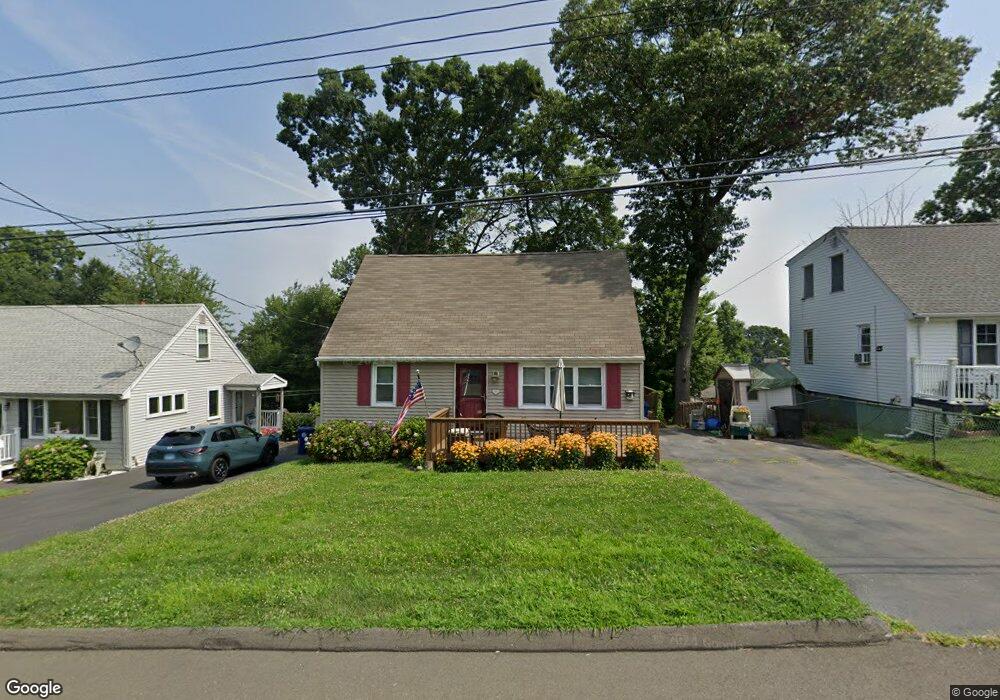
89 Hickory St West Haven, CT 06516
West Shore NeighborhoodEstimated Value: $351,352 - $422,000
4
Beds
1
Bath
1,267
Sq Ft
$302/Sq Ft
Est. Value
About This Home
This home is located at 89 Hickory St, West Haven, CT 06516 and is currently estimated at $383,088, approximately $302 per square foot. 89 Hickory St is a home located in New Haven County with nearby schools including Carrigan 5/6 Intermediate School, Harry M. Bailey Middle School, and West Haven High School.
Ownership History
Date
Name
Owned For
Owner Type
Purchase Details
Closed on
Sep 24, 2015
Sold by
King John D
Bought by
King John D and King Helene K
Current Estimated Value
Purchase Details
Closed on
May 9, 2013
Sold by
King Helene
Bought by
King John D
Purchase Details
Closed on
Mar 14, 1990
Sold by
Hawley Brian E
Bought by
King John
Home Financials for this Owner
Home Financials are based on the most recent Mortgage that was taken out on this home.
Original Mortgage
$127,650
Interest Rate
10.02%
Mortgage Type
Purchase Money Mortgage
Purchase Details
Closed on
Jun 8, 1987
Sold by
Bellard Robert L
Bought by
Hawley Brian E
Home Financials for this Owner
Home Financials are based on the most recent Mortgage that was taken out on this home.
Original Mortgage
$70,000
Interest Rate
10.38%
Mortgage Type
Purchase Money Mortgage
Create a Home Valuation Report for This Property
The Home Valuation Report is an in-depth analysis detailing your home's value as well as a comparison with similar homes in the area
Home Values in the Area
Average Home Value in this Area
Purchase History
| Date | Buyer | Sale Price | Title Company |
|---|---|---|---|
| King John D | -- | -- | |
| King John D | -- | -- | |
| King John D | -- | -- | |
| King John D | -- | -- | |
| King John | $138,000 | -- | |
| Hawley Brian E | $149,000 | -- |
Source: Public Records
Mortgage History
| Date | Status | Borrower | Loan Amount |
|---|---|---|---|
| Previous Owner | Hawley Brian E | $127,650 | |
| Previous Owner | Hawley Brian E | $70,000 |
Source: Public Records
Tax History
| Year | Tax Paid | Tax Assessment Tax Assessment Total Assessment is a certain percentage of the fair market value that is determined by local assessors to be the total taxable value of land and additions on the property. | Land | Improvement |
|---|---|---|---|---|
| 2025 | $6,914 | $210,350 | $82,040 | $128,310 |
| 2024 | $6,380 | $136,150 | $56,770 | $79,380 |
| 2023 | $6,140 | $136,150 | $56,770 | $79,380 |
| 2022 | $6,030 | $136,150 | $56,770 | $79,380 |
| 2021 | $6,030 | $136,150 | $56,770 | $79,380 |
| 2020 | $6,029 | $124,040 | $51,940 | $72,100 |
| 2019 | $5,837 | $124,040 | $51,940 | $72,100 |
| 2018 | $5,754 | $124,040 | $51,940 | $72,100 |
| 2017 | $5,599 | $124,040 | $51,940 | $72,100 |
| 2016 | $5,537 | $124,040 | $51,940 | $72,100 |
| 2015 | $5,460 | $136,920 | $57,470 | $79,450 |
| 2014 | $5,460 | $136,920 | $57,470 | $79,450 |
Source: Public Records
Map
Nearby Homes
- 206 Highland Ave
- 74 Wilson Ave
- 99 Roosevelt Ave
- 86 Roosevelt Ave
- 164 Arlington St
- 22 Parker Ave
- 118 Arlington St
- 18 Albion Ave
- 45 Arlington St
- 920 Ocean Ave Unit E1
- 40 Sorensen Rd
- 16 Sorensen Rd
- 51 Woody Ln
- 292 Richmond Ave
- 330 Savin Ave Unit 76
- 330 Savin Ave Unit 32
- 70 Edward St
- 46 Central Ave
- 23 Warner Ave
- 248 William St
Your Personal Tour Guide
Ask me questions while you tour the home.