Estimated Value: $534,000 - $591,000
3
Beds
1
Bath
1,214
Sq Ft
$465/Sq Ft
Est. Value
About This Home
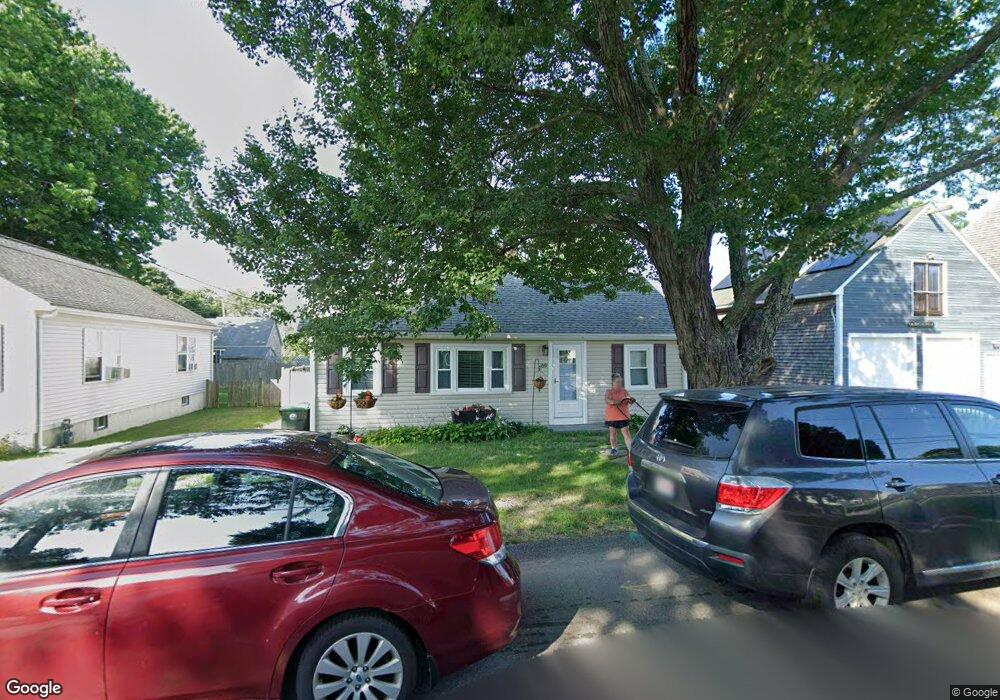
This home is located at 89 June St, Marshfield, MA 02050 and is currently estimated at $564,996, approximately $465 per square foot. 89 June St is a home located in Plymouth County with nearby schools including Governor Edward Winslow School, Furnace Brook Middle School, and Marshfield High School.
Ownership History
Date
Name
Owned For
Owner Type
Purchase Details
Closed on
Nov 30, 1995
Sold by
King Michael O and King Susan
Bought by
Sidlauskas John T
Current Estimated Value
Purchase Details
Closed on
Nov 2, 1990
Sold by
Dubois John R
Bought by
King Michael O
Purchase Details
Closed on
May 11, 1990
Sold by
Bates Denise A
Bought by
Dubois John R
Create a Home Valuation Report for This Property
The Home Valuation Report is an in-depth analysis detailing your home's value as well as a comparison with similar homes in the area
Home Values in the Area
Average Home Value in this Area
Purchase History
| Date | Buyer | Sale Price | Title Company |
|---|---|---|---|
| Sidlauskas John T | $98,000 | -- | |
| Sidlauskas John T | $98,000 | -- | |
| King Michael O | $111,000 | -- | |
| Dubois John R | $85,000 | -- |
Source: Public Records
Mortgage History
| Date | Status | Borrower | Loan Amount |
|---|---|---|---|
| Open | Dubois John R | $237,500 |
Source: Public Records
Tax History
| Year | Tax Paid | Tax Assessment Tax Assessment Total Assessment is a certain percentage of the fair market value that is determined by local assessors to be the total taxable value of land and additions on the property. | Land | Improvement |
|---|---|---|---|---|
| 2025 | $4,417 | $446,200 | $317,600 | $128,600 |
| 2024 | $4,376 | $421,200 | $297,800 | $123,400 |
| 2023 | $4,196 | $370,400 | $268,000 | $102,400 |
| 2022 | $4,196 | $324,000 | $228,300 | $95,700 |
| 2021 | $4,011 | $304,100 | $218,400 | $85,700 |
| 2020 | $3,590 | $269,300 | $188,600 | $80,700 |
| 2019 | $3,536 | $264,300 | $188,600 | $75,700 |
| 2018 | $3,534 | $264,300 | $188,600 | $75,700 |
| 2017 | $3,356 | $244,600 | $178,700 | $65,900 |
| 2016 | $3,255 | $234,500 | $168,700 | $65,800 |
| 2015 | $3,117 | $234,500 | $168,700 | $65,800 |
| 2014 | $3,118 | $234,600 | $168,700 | $65,900 |
Source: Public Records
Map
Nearby Homes
Your Personal Tour Guide
Ask me questions while you tour the home.