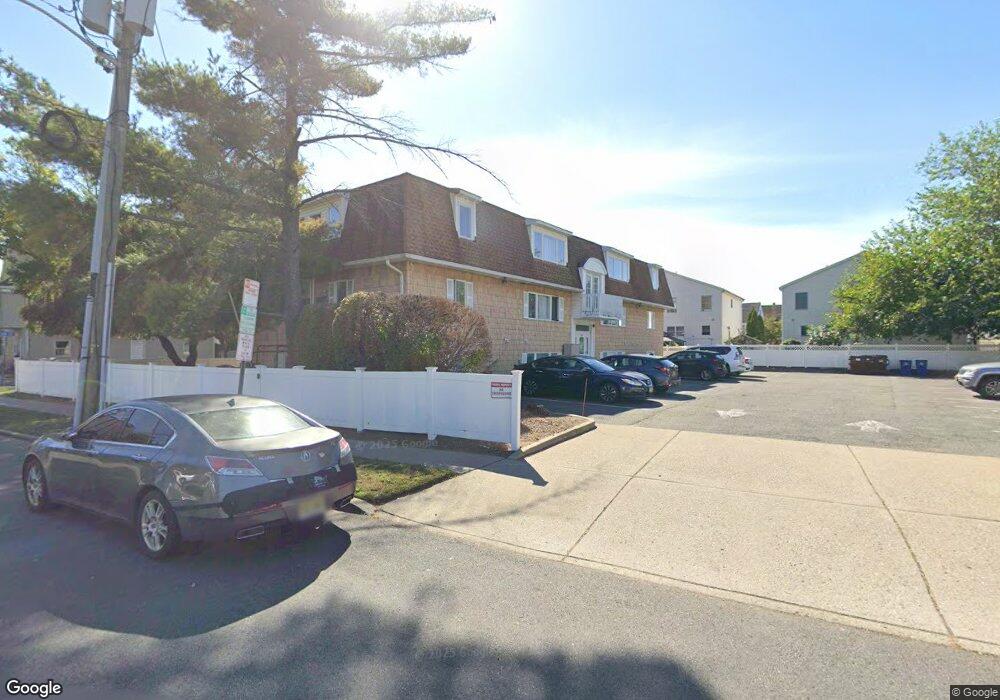
89 Kansas St Hackensack, NJ 07601
Estimated Value: $287,388 - $303,000
Studio
--
Bath
717
Sq Ft
$414/Sq Ft
Est. Value
About This Home
This home is located at 89 Kansas St, Hackensack, NJ 07601 and is currently estimated at $296,597, approximately $413 per square foot. 89 Kansas St is a home located in Bergen County with nearby schools including Hackensack High School and George Washington School.
Ownership History
Date
Name
Owned For
Owner Type
Purchase Details
Closed on
Jul 22, 2024
Sold by
Castaneda Dinah M and Castaneda Keziah M
Bought by
Park Scott J
Current Estimated Value
Home Financials for this Owner
Home Financials are based on the most recent Mortgage that was taken out on this home.
Original Mortgage
$145,000
Interest Rate
6.07%
Mortgage Type
New Conventional
Purchase Details
Closed on
Nov 25, 2020
Sold by
Castaneda Dinah M
Bought by
Castaneda Dinah M and Castaneda Kezia M
Home Financials for this Owner
Home Financials are based on the most recent Mortgage that was taken out on this home.
Original Mortgage
$136,000
Interest Rate
2.8%
Mortgage Type
Balloon
Purchase Details
Closed on
May 1, 2006
Sold by
Gesner Carmella
Bought by
Castaneda Dinah M
Home Financials for this Owner
Home Financials are based on the most recent Mortgage that was taken out on this home.
Original Mortgage
$169,100
Interest Rate
6.55%
Create a Home Valuation Report for This Property
The Home Valuation Report is an in-depth analysis detailing your home's value as well as a comparison with similar homes in the area
Home Values in the Area
Average Home Value in this Area
Purchase History
| Date | Buyer | Sale Price | Title Company |
|---|---|---|---|
| Park Scott J | $280,000 | Berkshire Title Llc | |
| Park Scott J | $280,000 | Berkshire Title Llc | |
| Castaneda Dinah M | -- | Amrock | |
| Castaneda Dinah M | -- | Amrock | |
| Castaneda Dinah M | $178,000 | -- |
Source: Public Records
Mortgage History
| Date | Status | Borrower | Loan Amount |
|---|---|---|---|
| Previous Owner | Park Scott J | $145,000 | |
| Previous Owner | Castaneda Dinah M | $136,000 | |
| Previous Owner | Castaneda Dinah M | $169,100 |
Source: Public Records
Tax History
| Year | Tax Paid | Tax Assessment Tax Assessment Total Assessment is a certain percentage of the fair market value that is determined by local assessors to be the total taxable value of land and additions on the property. | Land | Improvement |
|---|---|---|---|---|
| 2025 | $4,651 | $152,200 | $72,500 | $79,700 |
| 2024 | $4,382 | $152,200 | $72,500 | $79,700 |
| 2023 | $4,195 | $152,200 | $72,500 | $79,700 |
| 2022 | $4,195 | $149,700 | $70,000 | $79,700 |
| 2021 | $4,097 | $122,000 | $58,000 | $64,000 |
| 2020 | $4,037 | $122,000 | $58,000 | $64,000 |
| 2019 | $3,669 | $109,300 | $56,500 | $52,800 |
| 2018 | $3,710 | $108,700 | $56,000 | $52,700 |
| 2017 | $3,661 | $107,200 | $55,000 | $52,200 |
| 2016 | $3,601 | $106,600 | $55,000 | $51,600 |
| 2015 | $5,334 | $152,400 | $50,300 | $102,100 |
| 2014 | $5,063 | $152,400 | $50,300 | $102,100 |
Source: Public Records
Map
Nearby Homes
- 99 Kansas St
- 113 Kansas St
- 84 Kansas St
- 115 Kansas St
- 75 Union St Unit 5E
- 54 Polifly Rd Unit 201
- 72 Lawrence St
- 62 Frederick St Unit 1
- 115 Polifly Rd Unit 5D
- 311 Marvin Ave
- 301 Beech St Unit 10I
- 301 Beech St Unit 2B
- 337 Hudson St
- 90 Prospect Ave Unit 2A
- 90 Prospect Ave Unit 9B
- 115 River Rd
- 150 Overlook Ave Unit 10H
- 150 Overlook Ave Unit 7F
- 150 Overlook Ave Unit 12E
- 168 Clay St Unit 70
- 89 Kansas St
- 89 Kansas St Unit 3B
- 89 Kansas St
- 89 Kansas St
- 89 Kansas St
- 89 Kansas St
- 89 Kansas St
- 89 Kansas St Unit 3C
- 89 Kansas St Unit C003D
- 89 Kansas St
- 89 Kansas St
- 89 Kansas St
- 89 Kansas St Unit 2B
- 89 Kansas St Unit 2C
- 89 Kansas St Unit 2D
- 89 Kansas St Unit 1A
- 89 Kansas St Unit 3A
- 89 Kansas St Unit 3D
- 89 Kansas St Unit 1D
- 86 Ackerson St
Your Personal Tour Guide
Ask me questions while you tour the home.