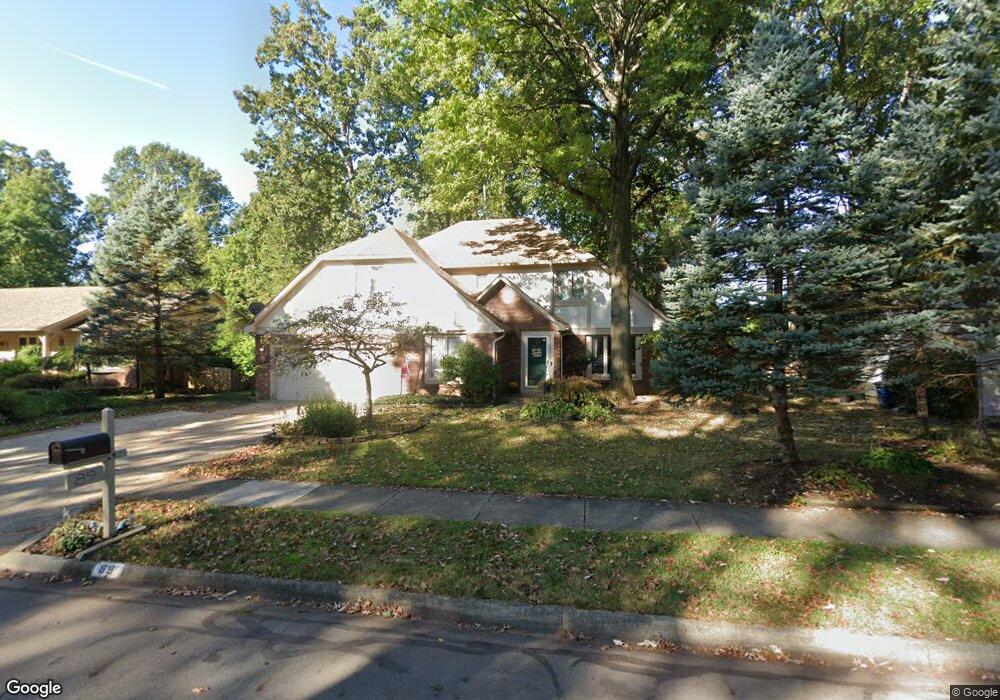
89 Keethler Dr N Westerville, OH 43081
Estimated Value: $472,173 - $559,000
4
Beds
3
Baths
2,607
Sq Ft
$196/Sq Ft
Est. Value
About This Home
This home is located at 89 Keethler Dr N, Westerville, OH 43081 and is currently estimated at $512,043, approximately $196 per square foot. 89 Keethler Dr N is a home located in Franklin County with nearby schools including Mark Twain Elementary School, Walnut Springs Middle School, and Westerville-North High School.
Ownership History
Date
Name
Owned For
Owner Type
Purchase Details
Closed on
Aug 23, 2006
Sold by
Boulanger Charles E and Boulanger Rachel A
Bought by
Deichmiller James B and Deichmiller Laura A
Current Estimated Value
Home Financials for this Owner
Home Financials are based on the most recent Mortgage that was taken out on this home.
Original Mortgage
$142,500
Outstanding Balance
$84,311
Interest Rate
6.78%
Mortgage Type
Purchase Money Mortgage
Estimated Equity
$427,732
Purchase Details
Closed on
Jul 23, 1998
Sold by
Abolhasani Yadollah
Bought by
Boulanger Charles E and Boulanger Rachel A
Home Financials for this Owner
Home Financials are based on the most recent Mortgage that was taken out on this home.
Original Mortgage
$143,100
Interest Rate
7.03%
Purchase Details
Closed on
Apr 11, 1997
Sold by
Morgan William L and Coastal Bank Ssb
Bought by
Abolhasani Yadollah
Purchase Details
Closed on
Sep 1, 1979
Create a Home Valuation Report for This Property
The Home Valuation Report is an in-depth analysis detailing your home's value as well as a comparison with similar homes in the area
Home Values in the Area
Average Home Value in this Area
Purchase History
| Date | Buyer | Sale Price | Title Company |
|---|---|---|---|
| Deichmiller James B | $262,500 | Chicago Tit | |
| Boulanger Charles E | $178,900 | Chicago Title West | |
| Abolhasani Yadollah | $134,500 | -- | |
| -- | $98,000 | -- |
Source: Public Records
Mortgage History
| Date | Status | Borrower | Loan Amount |
|---|---|---|---|
| Open | Deichmiller James B | $142,500 | |
| Closed | Boulanger Charles E | $143,100 |
Source: Public Records
Tax History
| Year | Tax Paid | Tax Assessment Tax Assessment Total Assessment is a certain percentage of the fair market value that is determined by local assessors to be the total taxable value of land and additions on the property. | Land | Improvement |
|---|---|---|---|---|
| 2025 | $7,952 | $139,930 | $31,500 | $108,430 |
| 2024 | $7,952 | $139,930 | $31,500 | $108,430 |
| 2023 | $7,784 | $139,930 | $31,500 | $108,430 |
| 2022 | $7,791 | $106,930 | $25,340 | $81,590 |
| 2021 | $7,856 | $106,930 | $25,340 | $81,590 |
| 2020 | $7,833 | $106,930 | $25,340 | $81,590 |
| 2019 | $6,834 | $88,070 | $21,110 | $66,960 |
| 2018 | $6,485 | $88,070 | $21,110 | $66,960 |
| 2017 | $6,597 | $88,070 | $21,110 | $66,960 |
| 2016 | $6,473 | $77,210 | $20,720 | $56,490 |
| 2015 | $6,270 | $77,210 | $20,720 | $56,490 |
| 2014 | $6,274 | $77,210 | $20,720 | $56,490 |
| 2013 | $2,984 | $73,535 | $19,740 | $53,795 |
Source: Public Records
Map
Nearby Homes
- 262 Crawford Ct
- 961 E College Ave
- 960 Lakeland Dr
- 124 Mainsail Dr
- 852 Karen Ct
- 138 Wood St
- 1103 Blue Heron Dr
- 215 Mainsail Dr
- 1216 Hooverview Dr
- 687 E College Ave
- 862 Thirlwall Ct
- 629 Andrew Ave
- 1161 Tidewater Ct
- 1151 Scarlet Ct
- 1114 Forest View Ct
- 613 Deer Run Rd
- 7026 Sunbury Rd
- 655 Mohican Way
- 787 Centerpark Dr
- 8191 Maxtown Rd
- 81 Keethler Dr N
- 93 Keethler Dr N
- 94 N Hempstead Rd
- 94 S Hempstead Rd
- 86 N Hempstead Rd
- 102 N Hempstead Rd
- 73 Keethler Dr N
- 101 Keethler Dr N
- 86 S Hempstead Rd
- 94 Keethler Dr N
- 78 N Hempstead Rd
- 110 N Hempstead Rd
- 68 Keethler Dr N
- 65 Keethler Dr N
- 109 Keethler Dr N
- 104 Keethler Dr N
- 66 Massey Dr
- 70 N Hempstead Rd
- 118 N Hempstead Rd
- 1124 Lyndale Dr
Your Personal Tour Guide
Ask me questions while you tour the home.