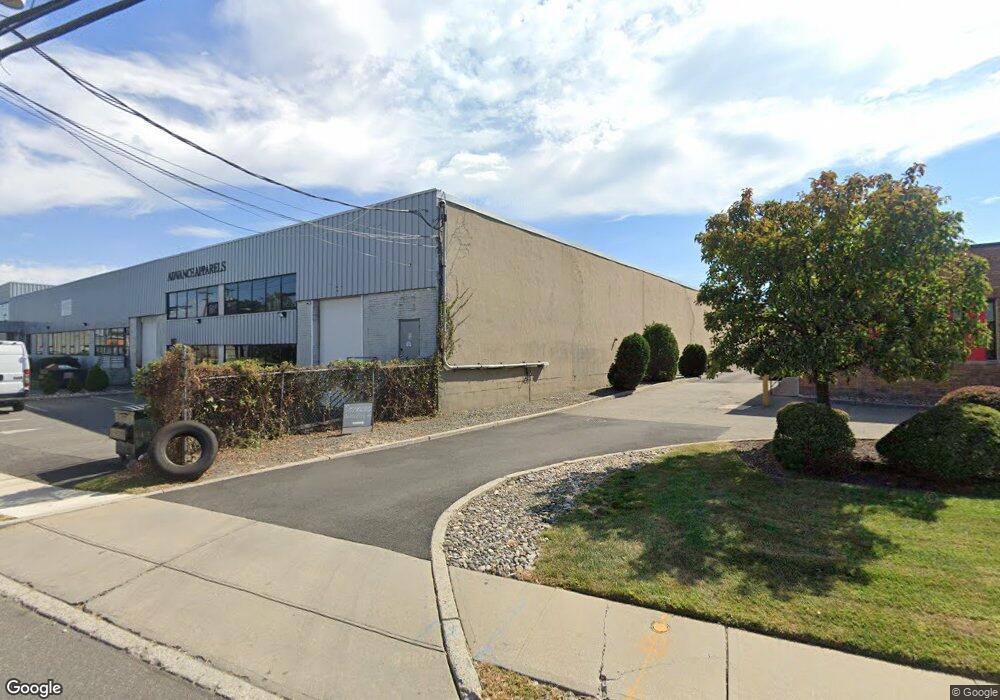
89 Leuning St South Hackensack, NJ 07606
Estimated Value: $4,805,391
Studio
--
Bath
--
Sq Ft
15,420
Sq Ft
About This Home
This home is located at 89 Leuning St, South Hackensack, NJ 07606 and is currently priced at $4,805,391. 89 Leuning St is a home located in Bergen County with nearby schools including Memorial Elementary School and George Washington School.
Ownership History
Date
Name
Owned For
Owner Type
Purchase Details
Closed on
Nov 8, 2021
Sold by
C & R Equity Holdings Llc
Bought by
Pacific City Bank
Current Estimated Value
Home Financials for this Owner
Home Financials are based on the most recent Mortgage that was taken out on this home.
Original Mortgage
$2,800,000
Outstanding Balance
$2,558,873
Interest Rate
2.8%
Mortgage Type
Small Business Administration
Purchase Details
Closed on
Jul 14, 2021
Sold by
Bacharach Leuning Llc
Bought by
C & R Equity Holdings Llc
Home Financials for this Owner
Home Financials are based on the most recent Mortgage that was taken out on this home.
Original Mortgage
$2,800,000
Interest Rate
2.8%
Mortgage Type
Small Business Administration
Purchase Details
Closed on
Jan 22, 2004
Sold by
Leuning Bacharach
Bought by
Spring In
Purchase Details
Closed on
Mar 23, 2000
Sold by
Bacharach Gerhard
Bought by
Bacharach/Leuning Llc
Create a Home Valuation Report for This Property
The Home Valuation Report is an in-depth analysis detailing your home's value as well as a comparison with similar homes in the area
Home Values in the Area
Average Home Value in this Area
Purchase History
| Date | Buyer | Sale Price | Title Company |
|---|---|---|---|
| Pacific City Bank | -- | Accommodation/Courtesy Recordi | |
| C & R Equity Holdings Llc | $4,000,000 | Fidelity National Ttl Ins Co | |
| Spring In | $956,616 | -- | |
| Bacharach/Leuning Llc | -- | -- |
Source: Public Records
Mortgage History
| Date | Status | Borrower | Loan Amount |
|---|---|---|---|
| Open | Pacific City Bank | $2,800,000 | |
| Previous Owner | C & R Equity Holdings Llc | $2,800,000 |
Source: Public Records
Tax History
| Year | Tax Paid | Tax Assessment Tax Assessment Total Assessment is a certain percentage of the fair market value that is determined by local assessors to be the total taxable value of land and additions on the property. | Land | Improvement |
|---|---|---|---|---|
| 2023 | $87,128 | $4,319,700 | $575,600 | $3,744,100 |
| 2022 | $87,128 | $3,951,400 | $575,600 | $3,375,800 |
| 2021 | $53,782 | $2,132,500 | $575,600 | $1,556,900 |
| 2020 | $54,697 | $2,037,900 | $575,600 | $1,462,300 |
| 2019 | $51,766 | $1,894,100 | $575,600 | $1,318,500 |
| 2018 | $44,809 | $1,624,100 | $575,600 | $1,048,500 |
| 2017 | $45,118 | $1,624,100 | $575,600 | $1,048,500 |
| 2016 | $44,890 | $1,624,100 | $575,600 | $1,048,500 |
| 2015 | $44,598 | $1,624,100 | $575,600 | $1,048,500 |
| 2014 | $45,901 | $1,695,000 | $575,600 | $1,119,400 |
Source: Public Records
Map
Nearby Homes
- 75 Cleveland St
- 115 Kansas St
- 113 Kansas St
- 99 Kansas St
- 115 Polifly Rd Unit 4F
- 115 Polifly Rd Unit 5D
- 84 Kansas St
- 279 Clark St Unit A-7
- 39 Union St Unit 105
- 110 Sussex St Unit 2F
- 311 Marvin Ave
- 337 Hudson St
- 229 Baldwin Ave
- 74 Union St
- 75 Union St Unit 5E
- 418 Taylor Ave
- 9 Vreeland Ave Unit 3A
- 378 Marvin Ave
- 140 Prospect St
- 460 Boulevard
Your Personal Tour Guide
Ask me questions while you tour the home.