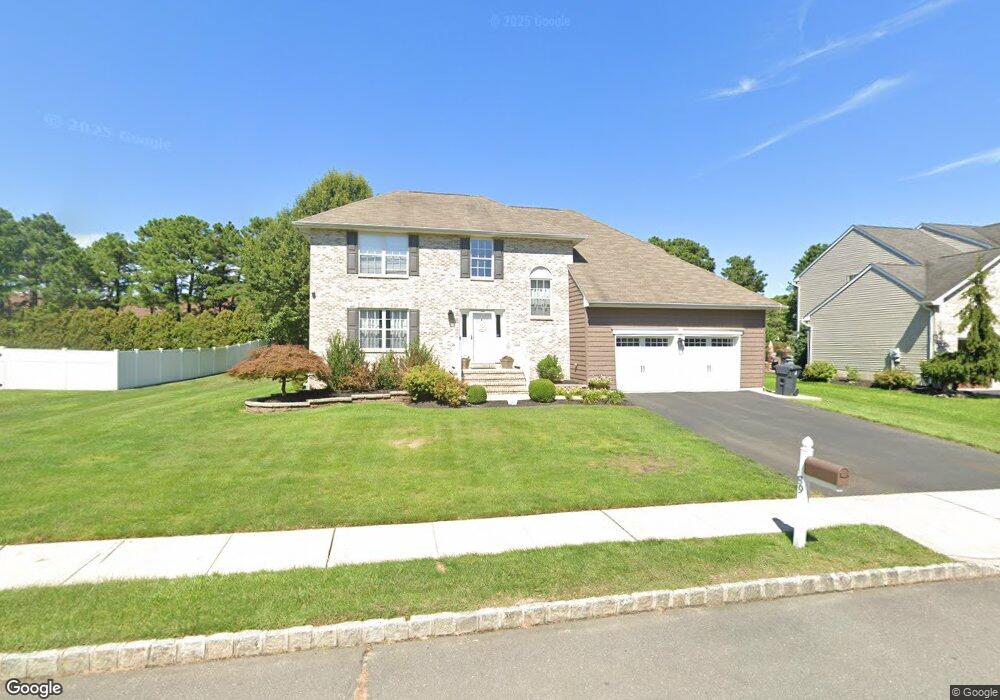
89 Lorelei Dr Howell, NJ 07731
Ramtown NeighborhoodEstimated Value: $751,683 - $897,000
4
Beds
2
Baths
2,284
Sq Ft
$356/Sq Ft
Est. Value
About This Home
This home is located at 89 Lorelei Dr, Howell, NJ 07731 and is currently estimated at $813,671, approximately $356 per square foot. 89 Lorelei Dr is a home located in Monmouth County with nearby schools including Ramtown School, Greenville School, and Howell Township Middle School South.
Ownership History
Date
Name
Owned For
Owner Type
Purchase Details
Closed on
Sep 23, 2005
Sold by
Marlboro Chase Llc
Bought by
Palazzo Louis and Palazzo Amy
Current Estimated Value
Home Financials for this Owner
Home Financials are based on the most recent Mortgage that was taken out on this home.
Original Mortgage
$100,000
Outstanding Balance
$53,298
Interest Rate
5.79%
Mortgage Type
New Conventional
Estimated Equity
$760,373
Create a Home Valuation Report for This Property
The Home Valuation Report is an in-depth analysis detailing your home's value as well as a comparison with similar homes in the area
Home Values in the Area
Average Home Value in this Area
Purchase History
| Date | Buyer | Sale Price | Title Company |
|---|---|---|---|
| Palazzo Louis | $428,790 | -- |
Source: Public Records
Mortgage History
| Date | Status | Borrower | Loan Amount |
|---|---|---|---|
| Open | Palazzo Louis | $100,000 |
Source: Public Records
Tax History
| Year | Tax Paid | Tax Assessment Tax Assessment Total Assessment is a certain percentage of the fair market value that is determined by local assessors to be the total taxable value of land and additions on the property. | Land | Improvement |
|---|---|---|---|---|
| 2025 | $10,435 | $641,500 | $267,800 | $373,700 |
| 2024 | $10,410 | $589,200 | $217,800 | $371,400 |
| 2023 | $10,410 | $560,000 | $192,800 | $367,200 |
| 2022 | $9,843 | $485,200 | $122,800 | $362,400 |
| 2021 | $9,843 | $430,200 | $107,800 | $322,400 |
| 2020 | $9,957 | $430,300 | $107,800 | $322,500 |
| 2019 | $10,102 | $428,400 | $107,800 | $320,600 |
| 2018 | $9,883 | $417,000 | $107,800 | $309,200 |
| 2017 | $9,933 | $414,400 | $107,800 | $306,600 |
| 2016 | $9,875 | $406,700 | $107,800 | $298,900 |
| 2015 | $9,870 | $402,200 | $107,800 | $294,400 |
| 2014 | $10,563 | $399,500 | $157,800 | $241,700 |
Source: Public Records
Map
Nearby Homes
- 19 Virginia Dr
- 51 Deborah Ln
- 39 Virginia Dr
- 28 Jacob Dr
- 24 Abraham Dr
- 23 Little Leaf Ln
- 50 Virginia Dr
- 24 Little Leaf Ln
- 457 Newtons Corner Rd
- 40 Pinyon St
- 7 Tracey Ct
- 2 Higgins Ct
- 902 Pioneer Dr
- 9 Ivy Place
- 18 Rutgers Dr
- 4 Pine Cone Ln
- 621 Illinois Ave
- 823 Herbertsville Rd
- 31 Briar Mills Dr
- 744 Millbrook Rd
Your Personal Tour Guide
Ask me questions while you tour the home.