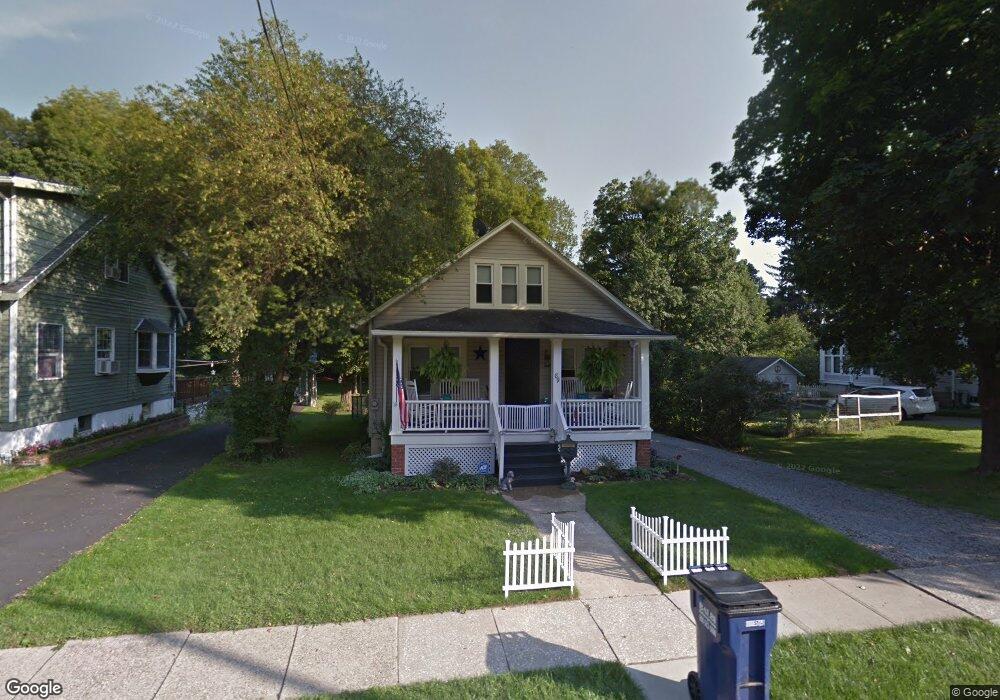
89 Madison St Newton, NJ 07860
Estimated Value: $352,175 - $423,000
--
Bed
--
Bath
1,328
Sq Ft
$287/Sq Ft
Est. Value
About This Home
This home is located at 89 Madison St, Newton, NJ 07860 and is currently estimated at $380,544, approximately $286 per square foot. 89 Madison St is a home located in Sussex County with nearby schools including Merriam Avenue School, Halsted Street Middle School, and Newton High School.
Ownership History
Date
Name
Owned For
Owner Type
Purchase Details
Closed on
May 19, 2011
Sold by
Elvidge Elizabeth A
Bought by
Koller Kelly
Current Estimated Value
Home Financials for this Owner
Home Financials are based on the most recent Mortgage that was taken out on this home.
Original Mortgage
$180,310
Outstanding Balance
$125,249
Interest Rate
4.87%
Mortgage Type
FHA
Estimated Equity
$255,295
Purchase Details
Closed on
Feb 29, 2008
Sold by
Elvidge Edward K and Elvidge Elizabeth A
Bought by
Elvidge Elizabeth A
Create a Home Valuation Report for This Property
The Home Valuation Report is an in-depth analysis detailing your home's value as well as a comparison with similar homes in the area
Home Values in the Area
Average Home Value in this Area
Purchase History
| Date | Buyer | Sale Price | Title Company |
|---|---|---|---|
| Koller Kelly | $185,000 | First American Title Ins Co | |
| Elvidge Elizabeth A | -- | None Available |
Source: Public Records
Mortgage History
| Date | Status | Borrower | Loan Amount |
|---|---|---|---|
| Open | Koller Kelly | $180,310 |
Source: Public Records
Tax History Compared to Growth
Tax History
| Year | Tax Paid | Tax Assessment Tax Assessment Total Assessment is a certain percentage of the fair market value that is determined by local assessors to be the total taxable value of land and additions on the property. | Land | Improvement |
|---|---|---|---|---|
| 2025 | $7,469 | $291,800 | $89,300 | $202,500 |
| 2024 | $7,757 | $273,900 | $76,100 | $197,800 |
| 2023 | $7,757 | $172,600 | $71,100 | $101,500 |
| 2022 | $7,788 | $172,600 | $71,100 | $101,500 |
| 2021 | $7,753 | $172,600 | $71,100 | $101,500 |
| 2020 | $7,634 | $172,600 | $71,100 | $101,500 |
| 2019 | $7,398 | $172,600 | $71,100 | $101,500 |
| 2018 | $7,358 | $172,600 | $71,100 | $101,500 |
| 2017 | $7,315 | $172,600 | $71,100 | $101,500 |
| 2016 | $7,197 | $172,600 | $71,100 | $101,500 |
| 2015 | $7,008 | $172,600 | $71,100 | $101,500 |
| 2014 | $6,863 | $172,600 | $71,100 | $101,500 |
Source: Public Records
Map
Nearby Homes
- 9 Lawnwood Ave
- 0 W Nelson St
- 37 Foster St
- 22 Woodside Ave
- 67 Ryerson Ave
- 103 Woodside Ave
- 13 Summit Ave
- 63 Merriam Ave
- 5 Jefferson St
- 76 Carriage Ln Unit 76
- 252 Spring St
- 49 Sussex St
- 40 Carriage Ln Unit 40
- 46 Pine St
- 21 Carriage Ln Unit 21
- 46 Orchard St Unit 2
- 36 Paterson Ave
- 8 Orchard St
- 52 Trinity St
- 14 Trenton Place