Estimated Value: $299,000 - $333,000
3
Beds
2
Baths
1,643
Sq Ft
$194/Sq Ft
Est. Value
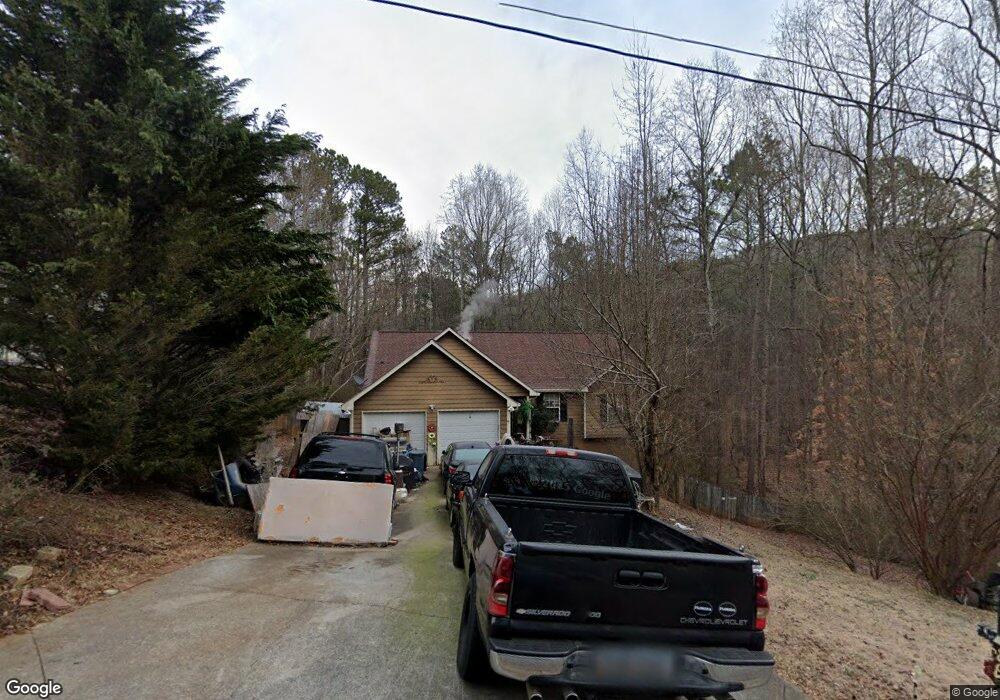
About This Home
This home is located at 89 Michelle Ln, Hiram, GA 30141 and is currently estimated at $318,439, approximately $193 per square foot. 89 Michelle Ln is a home located in Paulding County with nearby schools including Allgood Elementary School, Herschel Jones Middle School, and Paulding County High School.
Ownership History
Date
Name
Owned For
Owner Type
Purchase Details
Closed on
Jun 7, 2018
Sold by
Hartman Gregory S
Bought by
Hartman Gregory S and Hartman Kelly A
Current Estimated Value
Home Financials for this Owner
Home Financials are based on the most recent Mortgage that was taken out on this home.
Original Mortgage
$125,406
Outstanding Balance
$111,314
Interest Rate
5.75%
Mortgage Type
FHA
Estimated Equity
$207,125
Purchase Details
Closed on
Feb 29, 2008
Sold by
Secretary Of Veterans Affairs
Bought by
Hartman Gregory S and Hartman Kelly A
Home Financials for this Owner
Home Financials are based on the most recent Mortgage that was taken out on this home.
Original Mortgage
$105,664
Interest Rate
5.46%
Mortgage Type
FHA
Purchase Details
Closed on
Nov 6, 2007
Sold by
Wells Fargo Bank Na
Bought by
Secretary Of Veterans Affairs
Create a Home Valuation Report for This Property
The Home Valuation Report is an in-depth analysis detailing your home's value as well as a comparison with similar homes in the area
Home Values in the Area
Average Home Value in this Area
Purchase History
| Date | Buyer | Sale Price | Title Company |
|---|---|---|---|
| Hartman Gregory S | -- | -- | |
| Hartman Gregory S | -- | -- | |
| Secretary Of Veterans Affairs | -- | -- | |
| Wells Fargo Bank Na | $118,095 | -- |
Source: Public Records
Mortgage History
| Date | Status | Borrower | Loan Amount |
|---|---|---|---|
| Open | Hartman Gregory S | $125,406 | |
| Previous Owner | Hartman Gregory S | $105,664 |
Source: Public Records
Tax History Compared to Growth
Tax History
| Year | Tax Paid | Tax Assessment Tax Assessment Total Assessment is a certain percentage of the fair market value that is determined by local assessors to be the total taxable value of land and additions on the property. | Land | Improvement |
|---|---|---|---|---|
| 2024 | $2,949 | $121,784 | $12,000 | $109,784 |
| 2023 | $3,263 | $127,684 | $12,000 | $115,684 |
| 2022 | $2,804 | $109,420 | $12,000 | $97,420 |
| 2021 | $2,413 | $84,908 | $8,000 | $76,908 |
| 2020 | $2,070 | $71,532 | $8,000 | $63,532 |
| 2019 | $1,933 | $66,000 | $8,000 | $58,000 |
| 2018 | $1,809 | $61,920 | $8,000 | $53,920 |
| 2017 | $1,763 | $59,568 | $8,000 | $51,568 |
| 2016 | $1,598 | $54,724 | $8,000 | $46,724 |
| 2015 | $993 | $34,128 | $8,000 | $26,128 |
| 2014 | $940 | $31,632 | $8,000 | $23,632 |
| 2013 | -- | $24,800 | $8,000 | $16,800 |
Source: Public Records
Map
Nearby Homes
- 67 Michelle Ln
- 115 Michelle Ln
- 0 Michelle Ln Unit 7204290
- 0 Michelle Ln Unit 7320686
- 0 Michelle Ln
- 88 Michelle Ln
- 45 Michelle Ln
- 129 Michelle Ln
- 62 Michelle Ln
- 122 Michelle Ln
- 1097 Cochran Ridge Rd
- 1117 Cochran Ridge Rd
- 43 Gina Ct
- 20 Michelle Ln
- 36 Gina Ct
- 55 Gina Ct
- 0 Cochran Ridge Rd Unit 7341284
- 0 Cochran Ridge Rd Unit 7296523
- 0 Cochran Ridge Rd Unit 8341331
- 0 Cochran Ridge Rd Unit 7210901