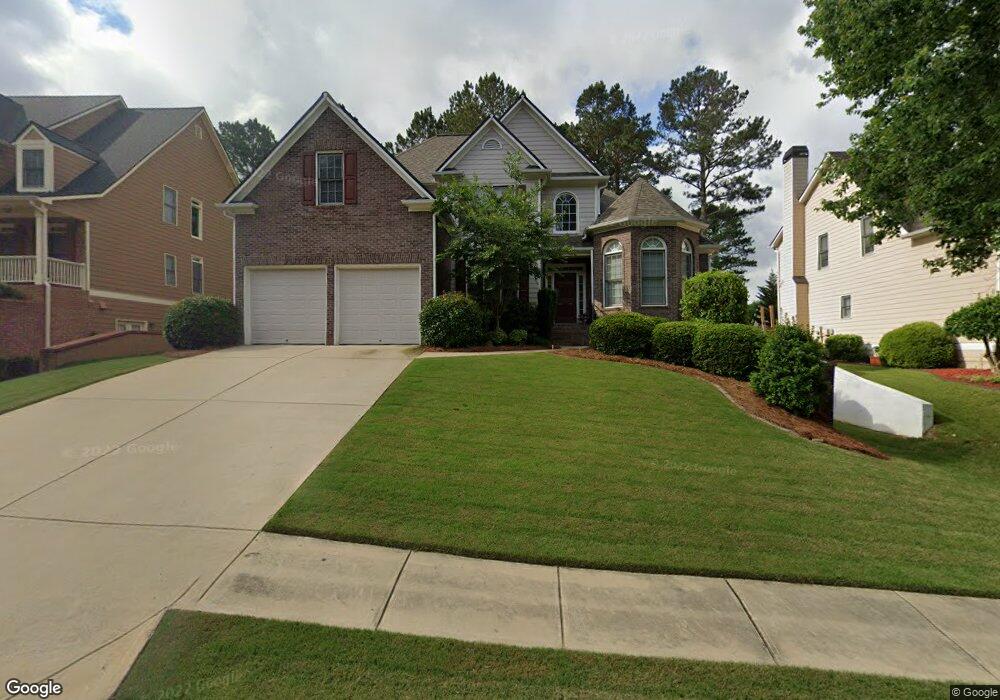
89 Misty View Ln Acworth, GA 30101
Cedarcrest NeighborhoodEstimated Value: $513,000 - $608,000
5
Beds
3
Baths
2,497
Sq Ft
$226/Sq Ft
Est. Value
About This Home
This home is located at 89 Misty View Ln, Acworth, GA 30101 and is currently estimated at $564,396, approximately $226 per square foot. 89 Misty View Ln is a home located in Paulding County with nearby schools including Floyd L. Shelton Elementary School at Crossroad, Sammy Mcclure Sr. Middle School, and North Paulding High School.
Ownership History
Date
Name
Owned For
Owner Type
Purchase Details
Closed on
Sep 14, 2007
Sold by
Prudential Relocation Inc
Bought by
Mullins Lyle K and Mullins Linda L
Current Estimated Value
Home Financials for this Owner
Home Financials are based on the most recent Mortgage that was taken out on this home.
Original Mortgage
$210,400
Outstanding Balance
$133,074
Interest Rate
6.55%
Mortgage Type
New Conventional
Estimated Equity
$431,322
Purchase Details
Closed on
Jul 7, 2007
Sold by
Stokes Terry N and Stokes Karen C
Bought by
Prudential Relocation Inc
Purchase Details
Closed on
Jan 9, 2004
Sold by
Whittemore Homes Inc
Home Financials for this Owner
Home Financials are based on the most recent Mortgage that was taken out on this home.
Original Mortgage
$50,000
Interest Rate
5.85%
Mortgage Type
New Conventional
Create a Home Valuation Report for This Property
The Home Valuation Report is an in-depth analysis detailing your home's value as well as a comparison with similar homes in the area
Home Values in the Area
Average Home Value in this Area
Purchase History
| Date | Buyer | Sale Price | Title Company |
|---|---|---|---|
| Mullins Lyle K | $263,000 | -- | |
| Prudential Relocation Inc | $263,000 | -- | |
| -- | $250,000 | -- |
Source: Public Records
Mortgage History
| Date | Status | Borrower | Loan Amount |
|---|---|---|---|
| Open | Mullins Lyle K | $210,400 | |
| Previous Owner | -- | $50,000 |
Source: Public Records
Tax History Compared to Growth
Tax History
| Year | Tax Paid | Tax Assessment Tax Assessment Total Assessment is a certain percentage of the fair market value that is determined by local assessors to be the total taxable value of land and additions on the property. | Land | Improvement |
|---|---|---|---|---|
| 2024 | $5,539 | $225,912 | $26,000 | $199,912 |
| 2023 | $5,347 | $207,616 | $26,000 | $181,616 |
| 2022 | $4,414 | $171,180 | $26,000 | $145,180 |
| 2021 | $4,052 | $136,424 | $26,000 | $110,424 |
| 2020 | $3,882 | $132,572 | $26,000 | $106,572 |
| 2019 | $3,339 | $112,680 | $26,000 | $86,680 |
| 2018 | $3,515 | $118,520 | $26,000 | $92,520 |
| 2017 | $3,358 | $111,800 | $28,000 | $83,800 |
| 2016 | $3,278 | $110,280 | $28,000 | $82,280 |
| 2015 | $3,178 | $105,120 | $28,000 | $77,120 |
| 2014 | $3,084 | $99,560 | $28,000 | $71,560 |
| 2013 | -- | $85,960 | $28,000 | $57,960 |
Source: Public Records
Map
Nearby Homes
- 176 Nightwind Trace
- 76 Ashdowne Way
- 16 Hawkstone Ct
- 118 Cedarcrest Village Ct
- 84 Cedarcrest Village Ln
- 64 Cedarcrest Village Ct
- 416 Fairway Dr
- 80 Lanier Ridge
- 179 Waterstone Point
- 232 Clubhouse Crossing
- 184 Clubhouse Crossing
- 427 Picketts Lake Dr
- 55 Clubhouse Way
- 26 Riverclub Rd
- 47 Vine Creek Ln
- 109 Applewood Ln
- 216 Brisbane Dr
- 75 Misty View Ln
- 105 Misty View Ln
- 61 Misty View Ln
- 0 Misty View Ln Unit 7400583
- 0 Misty View Ln Unit 7085240
- 0 Misty View Ln Unit 3218942
- 0 Misty View Ln Unit 3202785
- 0 Misty View Ln Unit 8376916
- 0 Misty View Ln Unit 8279618
- 0 Misty View Ln Unit 7464370
- 0 Misty View Ln
- 555 Golf Crest Dr Unit L
- 539 Golf Crest Dr Unit L
- 123 Misty View Ln
- 565 Golf Crest Dr
- 45 Misty View Ln
- 92 Misty View Ln
- 92 Misty View Ln Unit L
- 108 Misty View Ln
- 519 Golf Crest Dr