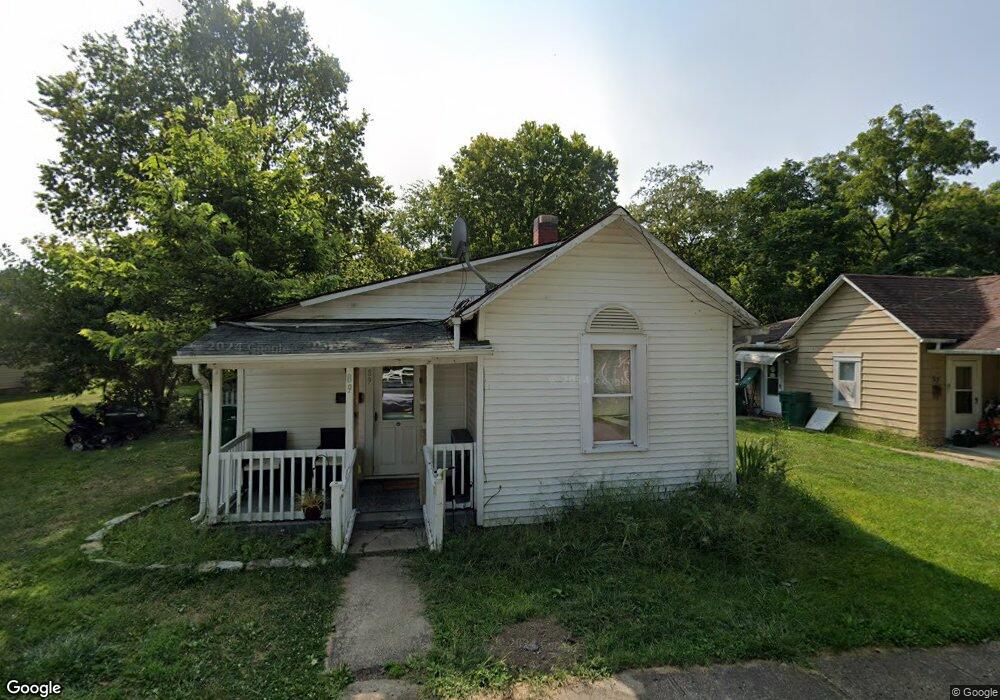
89 N Franklin St West Jefferson, OH 43162
Estimated Value: $156,000 - $216,000
2
Beds
1
Bath
987
Sq Ft
$181/Sq Ft
Est. Value
About This Home
This home is located at 89 N Franklin St, West Jefferson, OH 43162 and is currently estimated at $178,753, approximately $181 per square foot. 89 N Franklin St is a home located in Madison County with nearby schools including Norwood Elementary School, West Jefferson Middle School, and West Jefferson High School.
Ownership History
Date
Name
Owned For
Owner Type
Purchase Details
Closed on
Dec 8, 2022
Sold by
Orr Michael D and Orr Kathy A
Bought by
Orr Real Estate Investments Llc
Current Estimated Value
Purchase Details
Closed on
Dec 7, 2022
Sold by
Lelorr Properties 3 Llc
Bought by
Orr Michael D
Purchase Details
Closed on
Feb 17, 2010
Sold by
Merchants National Bank and Lantz Gary
Bought by
Lelorr Properties 3 Llc
Purchase Details
Closed on
Mar 6, 2009
Sold by
P S T Properties Llc
Bought by
Merchants National Bank
Purchase Details
Closed on
Nov 14, 2003
Sold by
Hilliker Charles C and Hilliker Karen
Bought by
P S T Properties Llc
Home Financials for this Owner
Home Financials are based on the most recent Mortgage that was taken out on this home.
Original Mortgage
$76,000
Interest Rate
6.01%
Mortgage Type
Purchase Money Mortgage
Purchase Details
Closed on
Jun 23, 1998
Sold by
Patterson Catherine J
Bought by
Hilliker Charles C
Home Financials for this Owner
Home Financials are based on the most recent Mortgage that was taken out on this home.
Original Mortgage
$30,150
Interest Rate
7.22%
Mortgage Type
New Conventional
Create a Home Valuation Report for This Property
The Home Valuation Report is an in-depth analysis detailing your home's value as well as a comparison with similar homes in the area
Home Values in the Area
Average Home Value in this Area
Purchase History
| Date | Buyer | Sale Price | Title Company |
|---|---|---|---|
| Orr Real Estate Investments Llc | -- | -- | |
| Orr Michael D | -- | -- | |
| Lelorr Properties 3 Llc | $650,000 | Premium Title | |
| Merchants National Bank | -- | Midland Title | |
| P S T Properties Llc | $56,000 | Midland Title | |
| Hilliker Charles C | $37,700 | -- |
Source: Public Records
Mortgage History
| Date | Status | Borrower | Loan Amount |
|---|---|---|---|
| Previous Owner | P S T Properties Llc | $76,000 | |
| Previous Owner | Hilliker Charles C | $30,150 |
Source: Public Records
Tax History Compared to Growth
Tax History
| Year | Tax Paid | Tax Assessment Tax Assessment Total Assessment is a certain percentage of the fair market value that is determined by local assessors to be the total taxable value of land and additions on the property. | Land | Improvement |
|---|---|---|---|---|
| 2024 | $1,402 | $29,470 | $9,370 | $20,100 |
| 2023 | $1,335 | $29,470 | $9,370 | $20,100 |
| 2022 | $1,084 | $22,240 | $7,560 | $14,680 |
| 2021 | $1,088 | $22,240 | $7,560 | $14,680 |
| 2020 | $1,108 | $22,240 | $7,560 | $14,680 |
| 2019 | $983 | $19,430 | $7,060 | $12,370 |
| 2018 | $915 | $19,430 | $7,060 | $12,370 |
| 2017 | $917 | $19,430 | $7,060 | $12,370 |
| 2016 | $820 | $17,030 | $7,060 | $9,970 |
| 2015 | $2,308 | $17,030 | $7,060 | $9,970 |
| 2014 | $2,308 | $17,030 | $7,060 | $9,970 |
| 2013 | -- | $18,120 | $7,320 | $10,800 |
Source: Public Records
Map
Nearby Homes
- 304 Middle Dr
- 63 Jones St
- 622 Brookdale Dr
- 700 Shawn Dr Unit 88
- 0 W Jeff Kiousville Rd Unit 225000725
- 1000 W Main St Unit 120
- 360 State Route 142 NE
- 125 Dogwood Ct
- 10763 Southwood Rd
- 8873 Canoe Dr
- 8830 Hubbard Dr N
- 8629 Canyon Cove Rd
- 8548 Canyon Cove Rd
- 749 Hubbard Rd
- 9519 High Free Pike
- 1890 Wilson Rd SE
- 8482 Dover Crest Ct
- 3150 Middle Pike
- 1280 Four Star Dr W
- 1278 Lieutenant Dr
- 77 N Franklin St
- 97 N Franklin St
- 296 Darbyview Dr
- 69 N Franklin St
- 84 N Franklin St
- 84 N Franklin St
- 70 N Franklin St
- 63 N Franklin St
- 266 Martin St
- 64 N Franklin St
- 300 Darbyview Dr
- 260 Martin St
- 53 N Franklin St
- 73 N Hampton St
- 54 N Franklin St
- 49 N Franklin St
- 63 N Hampton St
- 310 Darbyview Dr
- 295 Darbyview Dr
- 39 N Franklin St