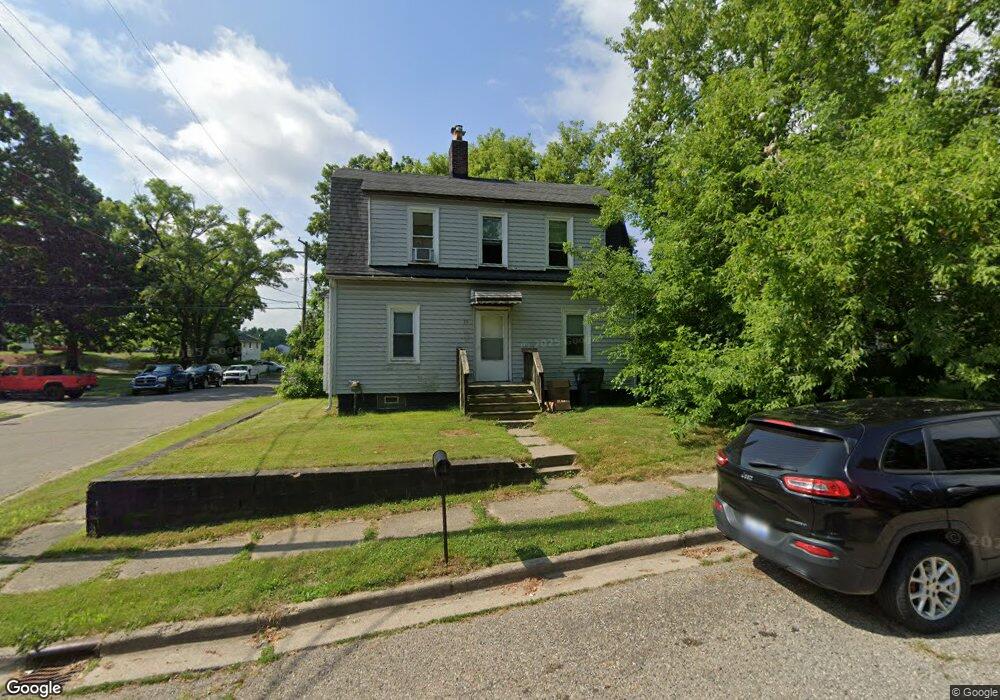
89 N Merrimac St Unit Bldg-Unit Pontiac, MI 48340
Estimated Value: $104,000 - $147,000
2
Beds
2
Baths
1,056
Sq Ft
$116/Sq Ft
Est. Value
About This Home
This home is located at 89 N Merrimac St Unit Bldg-Unit, Pontiac, MI 48340 and is currently estimated at $122,188, approximately $115 per square foot. 89 N Merrimac St Unit Bldg-Unit is a home located in Oakland County with nearby schools including Alcott School, Pontiac Middle School, and Pontiac High School.
Ownership History
Date
Name
Owned For
Owner Type
Purchase Details
Closed on
Sep 20, 2018
Sold by
Blue Key Investments Llc
Bought by
Munoz Jose
Current Estimated Value
Purchase Details
Closed on
Feb 27, 2018
Sold by
Midas Development Corp
Bought by
Blue Key Investments Llc
Purchase Details
Closed on
Nov 2, 2015
Sold by
Merrimac 89 Llc
Bought by
Midas Development Corp
Purchase Details
Closed on
Nov 21, 2012
Sold by
Ivezaj Franz John and Ivezaj Lindita
Bought by
Merrimac 89 Llc
Purchase Details
Closed on
Dec 9, 2011
Sold by
Oakland County Treasurer
Bought by
Ivezaj Franz J
Purchase Details
Closed on
Jan 2, 2008
Sold by
Fannie Mae
Bought by
Ivezaj Franz J
Purchase Details
Closed on
Mar 28, 2007
Sold by
Washington Mutual Bank
Bought by
Federal National Mortgage Association
Purchase Details
Closed on
Jan 9, 2007
Sold by
Martinez Sophia J
Bought by
Washington Mutual Bank
Create a Home Valuation Report for This Property
The Home Valuation Report is an in-depth analysis detailing your home's value as well as a comparison with similar homes in the area
Home Values in the Area
Average Home Value in this Area
Purchase History
| Date | Buyer | Sale Price | Title Company |
|---|---|---|---|
| Munoz Jose | $30,000 | Coretitle Llc | |
| Blue Key Investments Llc | $10,000 | Coretitle Llc | |
| Midas Development Corp | $10,000 | None Available | |
| Merrimac 89 Llc | $30,500 | None Available | |
| Ivezaj Franz J | $4,081 | None Available | |
| Ivezaj Franz J | $8,000 | Metropolitan | |
| Federal National Mortgage Association | -- | None Available | |
| Washington Mutual Bank | $71,621 | None Available |
Source: Public Records
Tax History Compared to Growth
Tax History
| Year | Tax Paid | Tax Assessment Tax Assessment Total Assessment is a certain percentage of the fair market value that is determined by local assessors to be the total taxable value of land and additions on the property. | Land | Improvement |
|---|---|---|---|---|
| 2024 | $1,292 | $40,970 | $0 | $0 |
| 2023 | $1,231 | $35,910 | $0 | $0 |
| 2022 | $1,251 | $31,680 | $0 | $0 |
| 2021 | $1,214 | $27,100 | $0 | $0 |
| 2020 | $1,119 | $23,450 | $0 | $0 |
| 2019 | $1,176 | $20,000 | $0 | $0 |
| 2018 | $2,816 | $18,330 | $0 | $0 |
| 2017 | $851 | $17,240 | $0 | $0 |
| 2016 | $1,076 | $14,750 | $0 | $0 |
| 2015 | -- | $14,140 | $0 | $0 |
| 2014 | -- | $13,200 | $0 | $0 |
| 2011 | -- | $16,580 | $0 | $0 |
Source: Public Records
Map
Nearby Homes
- 0 S Merrimac St Unit 20250035082
- 141 Parkdale Ave
- 137 Dresden Ave
- 109 W Kennett Rd
- 119 W Kennett Rd
- 201 Parkdale Ave
- 110 W Tennyson Ave
- 33 W Beverly Ave
- 998 Dewey St
- 54 Hudson Ave
- 709 Kinney Rd
- 686 Lounsbury Ave
- 18 E 18 E Rutgers Ave
- 0000 Blaine Ave
- 236 W Cornell Ave
- 134 W Fairmount Ave
- 255 W Rutgers Ave
- 117 W Strathmore Ave
- 111 Hamilton St
- 112 W Strathmore Ave
- 89 N Merrimac St
- 89 N Merrimac St
- 81 N Merrimac St
- 81 N Merrimac St
- 93 N Merrimac St
- 93 N Merrimac St
- 70 N Merrimac St
- 146 N Merrimac St
- 68 N Merrimac St
- 97 N Merrimac St
- 97 N Merrimac St
- 90 S Merrimac St
- 77 N Merrimac St Unit Bldg-Unit
- 77 N Merrimac St
- 98 S Merrimac St
- 73 N Merrimac St
- 99 N Merrimac St
- 101 N Merrimac St
- 69 N Merrimac St
- 69 N Merrimac St