Estimated Value: $328,000 - $346,000
3
Beds
2
Baths
1,156
Sq Ft
$292/Sq Ft
Est. Value
About This Home
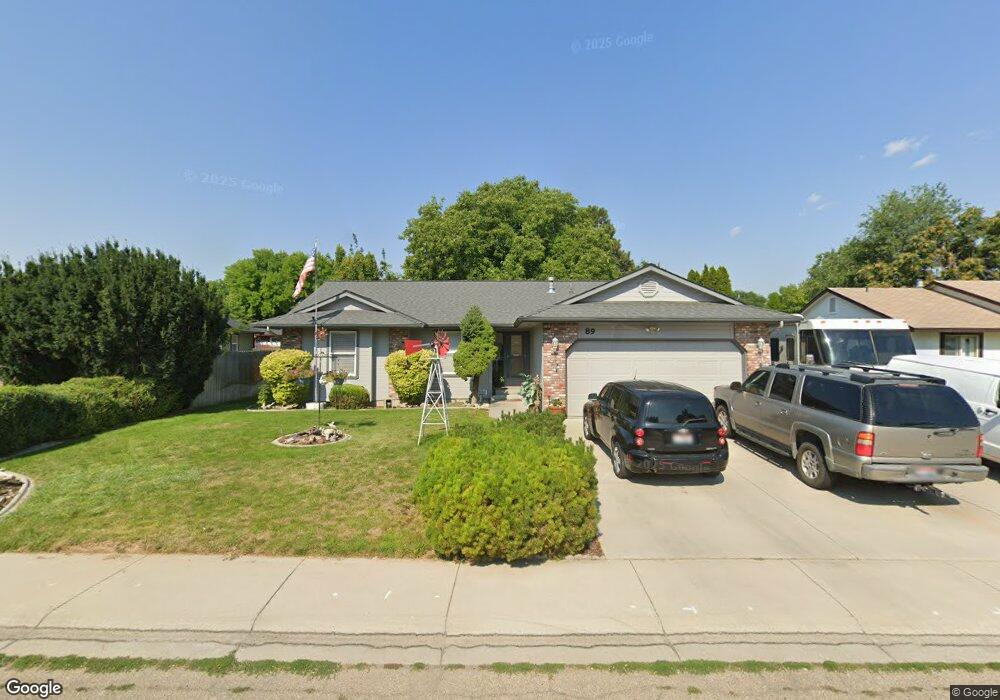
This home is located at 89 N Mirage St, Nampa, ID 83651 and is currently estimated at $336,981, approximately $291 per square foot. 89 N Mirage St is a home located in Canyon County with nearby schools including Centennial Elementary School, West Middle School, and Nampa Senior High School.
Ownership History
Date
Name
Owned For
Owner Type
Purchase Details
Closed on
Nov 21, 2024
Sold by
Current Frederick A and Landis Michelle Ann
Bought by
Current Fred A
Current Estimated Value
Purchase Details
Closed on
Mar 6, 2024
Sold by
Landis Cheryl Dawn
Bought by
Current Frederick A and Landis Michelle Ann
Purchase Details
Closed on
Dec 16, 2014
Sold by
Landis Cheryl D
Bought by
Landis Cheryl D
Home Financials for this Owner
Home Financials are based on the most recent Mortgage that was taken out on this home.
Original Mortgage
$30,000
Interest Rate
4%
Mortgage Type
Credit Line Revolving
Purchase Details
Closed on
Mar 23, 2007
Sold by
Landis Harold D
Bought by
Landis Cheryl A
Purchase Details
Closed on
Jan 24, 2007
Sold by
Landis Harold D
Bought by
Landis Harold D
Purchase Details
Closed on
May 4, 2005
Sold by
Clements G Keith and Jensen Margaret Karen Clements
Bought by
Clements Della H
Create a Home Valuation Report for This Property
The Home Valuation Report is an in-depth analysis detailing your home's value as well as a comparison with similar homes in the area
Home Values in the Area
Average Home Value in this Area
Purchase History
| Date | Buyer | Sale Price | Title Company |
|---|---|---|---|
| Current Fred A | -- | None Listed On Document | |
| Current Fred A | -- | None Listed On Document | |
| Current Frederick A | -- | None Listed On Document | |
| Landis Cheryl D | -- | Accommodation | |
| Landis Cheryl A | -- | None Available | |
| Landis Harold D | -- | None Available | |
| Clements Della H | -- | -- |
Source: Public Records
Mortgage History
| Date | Status | Borrower | Loan Amount |
|---|---|---|---|
| Previous Owner | Landis Cheryl D | $30,000 |
Source: Public Records
Tax History Compared to Growth
Tax History
| Year | Tax Paid | Tax Assessment Tax Assessment Total Assessment is a certain percentage of the fair market value that is determined by local assessors to be the total taxable value of land and additions on the property. | Land | Improvement |
|---|---|---|---|---|
| 2025 | $1,184 | $323,600 | $96,000 | $227,600 |
| 2024 | $1,184 | $316,200 | $96,000 | $220,200 |
| 2023 | $1,116 | $312,800 | $96,000 | $216,800 |
| 2022 | $2,471 | $334,700 | $108,000 | $226,700 |
| 2021 | $164 | $234,900 | $50,500 | $184,400 |
| 2020 | $47 | $187,600 | $42,000 | $145,600 |
| 2019 | $347 | $170,400 | $36,000 | $134,400 |
| 2018 | $255 | $0 | $0 | $0 |
| 2017 | $0 | $0 | $0 | $0 |
| 2016 | $0 | $0 | $0 | $0 |
| 2015 | -- | $0 | $0 | $0 |
| 2014 | -- | $97,700 | $18,000 | $79,700 |
Source: Public Records
Map
Nearby Homes
- 81 N Mirage St
- 919 Cove Arm Cir
- 375 Winther Blvd
- 214 Hudson Ave
- 6 N Borah Way
- 13 N Gem St
- 93 N Canyon St
- 1209 W Hudson Ave
- 809 Astor Ave
- 79 Ord Blvd
- 122 N Canyon St
- 308 N Gem St
- 20 S Cobblestone Ct
- 1382 W Kelby Ave
- 1104 W Elmore Ave
- 82 N Wedgwood Dr
- 35 N Fairview St
- 115 Ord Blvd
- 914 W Roberts Ave
- 23 N Zion Park Dr