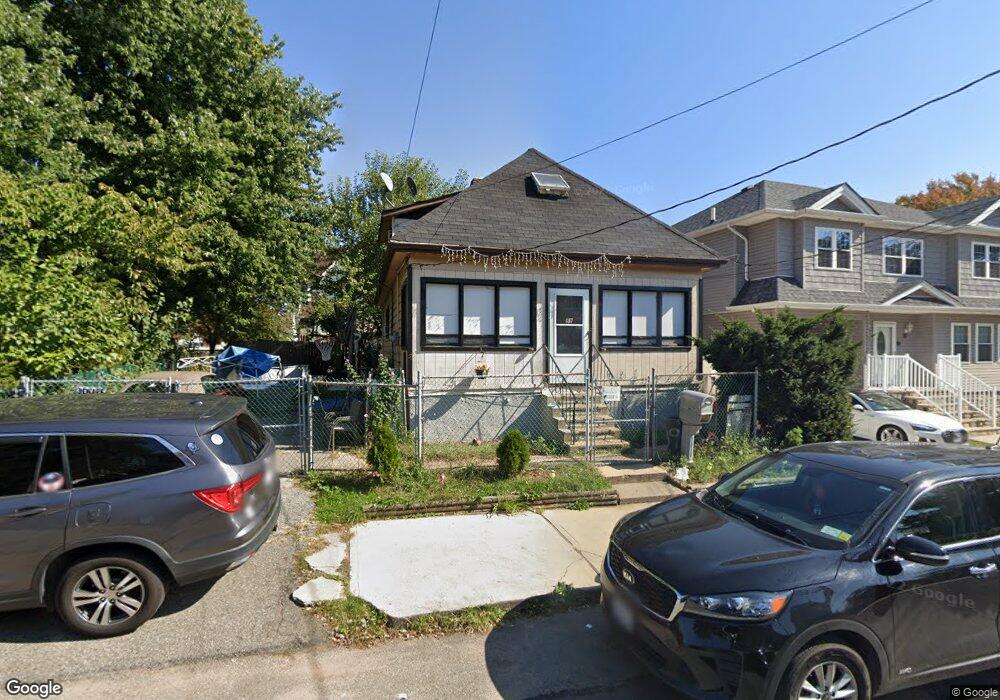
89 Northfield Ave Staten Island, NY 10303
Mariners Harbor NeighborhoodEstimated Value: $400,000 - $500,703
2
Beds
3
Baths
994
Sq Ft
$464/Sq Ft
Est. Value
About This Home
This home is located at 89 Northfield Ave, Staten Island, NY 10303 and is currently estimated at $461,426, approximately $464 per square foot. 89 Northfield Ave is a home located in Richmond County with nearby schools including P.S. 44 Thomas C Brown, I.S. 51 Edwin Markham, and Port Richmond High School.
Ownership History
Date
Name
Owned For
Owner Type
Purchase Details
Closed on
Dec 6, 2014
Sold by
Simanovsky Michael
Bought by
Simanovsky Michael and Simanovsky Aleksandra
Current Estimated Value
Home Financials for this Owner
Home Financials are based on the most recent Mortgage that was taken out on this home.
Original Mortgage
$186,750
Outstanding Balance
$143,049
Interest Rate
3.92%
Mortgage Type
New Conventional
Estimated Equity
$318,377
Purchase Details
Closed on
May 7, 2010
Sold by
Jpmorgan Chase Bank Na
Bought by
Simanovsky Michael
Home Financials for this Owner
Home Financials are based on the most recent Mortgage that was taken out on this home.
Original Mortgage
$82,500
Interest Rate
5.23%
Mortgage Type
New Conventional
Purchase Details
Closed on
Apr 8, 2003
Sold by
Amin Nagi N and Amin Mervat
Bought by
Menzies Greg E and Menzies Gloria J W
Create a Home Valuation Report for This Property
The Home Valuation Report is an in-depth analysis detailing your home's value as well as a comparison with similar homes in the area
Home Values in the Area
Average Home Value in this Area
Purchase History
| Date | Buyer | Sale Price | Title Company |
|---|---|---|---|
| Simanovsky Michael | -- | Stewart Title Insurance Co | |
| Simanovsky Michael | $110,000 | None Available | |
| Menzies Greg E | $200,000 | -- |
Source: Public Records
Mortgage History
| Date | Status | Borrower | Loan Amount |
|---|---|---|---|
| Open | Simanovsky Michael | $186,750 | |
| Closed | Simanovsky Michael | $82,500 |
Source: Public Records
Tax History Compared to Growth
Tax History
| Year | Tax Paid | Tax Assessment Tax Assessment Total Assessment is a certain percentage of the fair market value that is determined by local assessors to be the total taxable value of land and additions on the property. | Land | Improvement |
|---|---|---|---|---|
| 2025 | $3,860 | $25,020 | $7,376 | $17,644 |
| 2024 | $3,860 | $25,440 | $6,844 | $18,596 |
| 2023 | $3,682 | $18,132 | $6,828 | $11,304 |
| 2022 | $3,552 | $24,300 | $9,060 | $15,240 |
| 2021 | $3,644 | $24,180 | $9,060 | $15,120 |
| 2020 | $3,606 | $22,500 | $9,060 | $13,440 |
| 2019 | $3,363 | $20,820 | $9,060 | $11,760 |
| 2018 | $3,080 | $15,110 | $8,912 | $6,198 |
| 2017 | $3,023 | $14,828 | $8,513 | $6,315 |
| 2016 | $2,885 | $14,431 | $8,579 | $5,852 |
| 2015 | $2,561 | $14,146 | $6,726 | $7,420 |
| 2014 | $2,561 | $13,346 | $5,390 | $7,956 |
Source: Public Records
Map
Nearby Homes
- 96 Northfield Ave
- 25 Benjamin Place
- 24 Martineau St
- 134 South Ave
- 115 South Ave
- 53 South Ave
- 44 Betty Ct
- 169 Arlington Ave
- 10 South Ave
- 17 Federal Place
- 176 Arlington Place
- 154 South Ave
- 137 South Ave
- 22 Betty Ct
- 136 Holland Ave
- 17 Holland Ave
- 27 Grandview Ave
- 113 Grandview Ave
- 3146 Richmond Terrace
- 16 Mersereau Ave
- 101 Northfield Ave
- 88 Arlington Ave
- 80 Arlington Ave
- 92 Arlington Ave
- 103 Northfield Ave
- 76 Northfield Ave
- 96 Arlington Ave
- 94 Northfield Ave
- 100 Northfield Ave
- 79 Northfield Ave
- 90 Northfield Ave
- 104 Arlington Ave
- 72 Arlington Ave
- 6 Bailey Place
- 108 Northfield Ave
- 106 Arlington Ave
- 70 Arlington Ave
- 11 Fancher Place
- 10 Bailey Place
- 1 Fancher Place