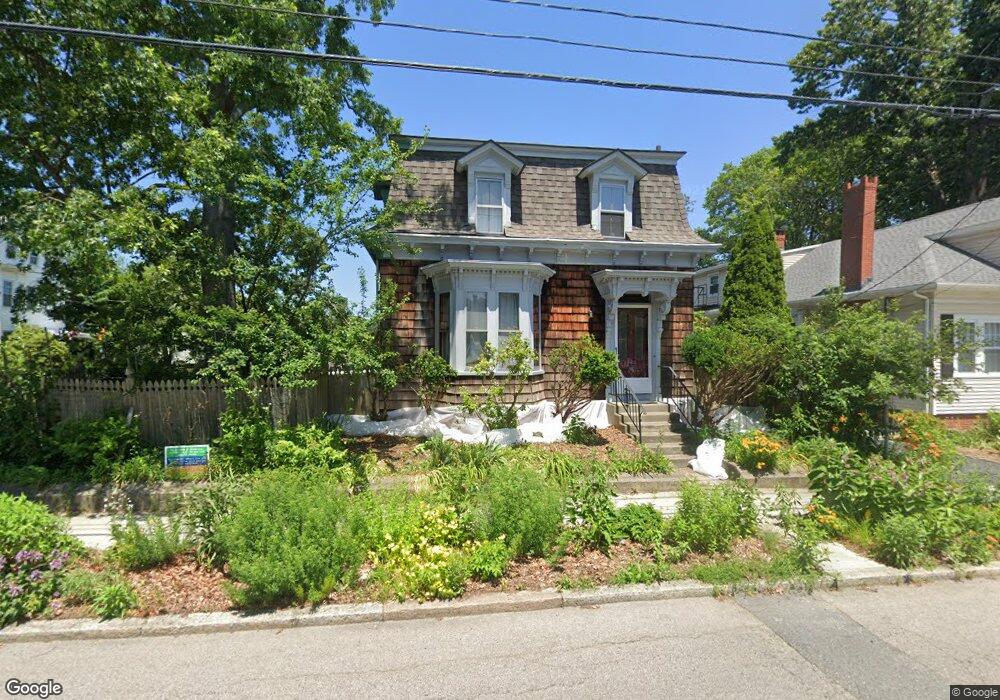
89 Pidge Ave Pawtucket, RI 02860
Oak Hill NeighborhoodEstimated Value: $535,755 - $803,000
4
Beds
2
Baths
1,816
Sq Ft
$362/Sq Ft
Est. Value
About This Home
This home is located at 89 Pidge Ave, Pawtucket, RI 02860 and is currently estimated at $657,939, approximately $362 per square foot. 89 Pidge Ave is a home located in Providence County with nearby schools including International Charter School, Blackstone Academy Charter School, and Jewish Community Day School Of Rhode Island.
Ownership History
Date
Name
Owned For
Owner Type
Purchase Details
Closed on
Mar 26, 2002
Sold by
Lafond John Harold
Bought by
Curtis Lynn M and Montlick Terry F
Current Estimated Value
Home Financials for this Owner
Home Financials are based on the most recent Mortgage that was taken out on this home.
Original Mortgage
$200,000
Interest Rate
6.91%
Purchase Details
Closed on
May 1, 1995
Sold by
Marcotte Nancy S
Bought by
Lafond John H
Home Financials for this Owner
Home Financials are based on the most recent Mortgage that was taken out on this home.
Original Mortgage
$124,650
Interest Rate
8.33%
Purchase Details
Closed on
Jul 18, 1990
Sold by
Granlund Carolyn M
Bought by
Marcotte Nancy S
Home Financials for this Owner
Home Financials are based on the most recent Mortgage that was taken out on this home.
Original Mortgage
$61,200
Interest Rate
9.94%
Create a Home Valuation Report for This Property
The Home Valuation Report is an in-depth analysis detailing your home's value as well as a comparison with similar homes in the area
Home Values in the Area
Average Home Value in this Area
Purchase History
| Date | Buyer | Sale Price | Title Company |
|---|---|---|---|
| Curtis Lynn M | $250,000 | -- | |
| Lafond John H | $88,000 | -- | |
| Marcotte Nancy S | $76,500 | -- |
Source: Public Records
Mortgage History
| Date | Status | Borrower | Loan Amount |
|---|---|---|---|
| Open | Marcotte Nancy S | $163,000 | |
| Closed | Marcotte Nancy S | $200,000 | |
| Previous Owner | Marcotte Nancy S | $124,650 | |
| Previous Owner | Marcotte Nancy S | $61,200 |
Source: Public Records
Tax History Compared to Growth
Tax History
| Year | Tax Paid | Tax Assessment Tax Assessment Total Assessment is a certain percentage of the fair market value that is determined by local assessors to be the total taxable value of land and additions on the property. | Land | Improvement |
|---|---|---|---|---|
| 2024 | $4,636 | $375,700 | $168,600 | $207,100 |
| 2023 | $4,501 | $265,700 | $94,500 | $171,200 |
| 2022 | $4,405 | $265,700 | $94,500 | $171,200 |
| 2021 | $4,405 | $265,700 | $94,500 | $171,200 |
| 2020 | $3,938 | $188,500 | $67,500 | $121,000 |
| 2019 | $3,938 | $188,500 | $67,500 | $121,000 |
| 2018 | $3,795 | $188,500 | $67,500 | $121,000 |
| 2017 | $3,965 | $174,500 | $76,200 | $98,300 |
| 2016 | $3,820 | $174,500 | $76,200 | $98,300 |
| 2015 | $3,820 | $174,500 | $76,200 | $98,300 |
| 2014 | $3,703 | $160,600 | $76,200 | $84,400 |
Source: Public Records
Map
Nearby Homes