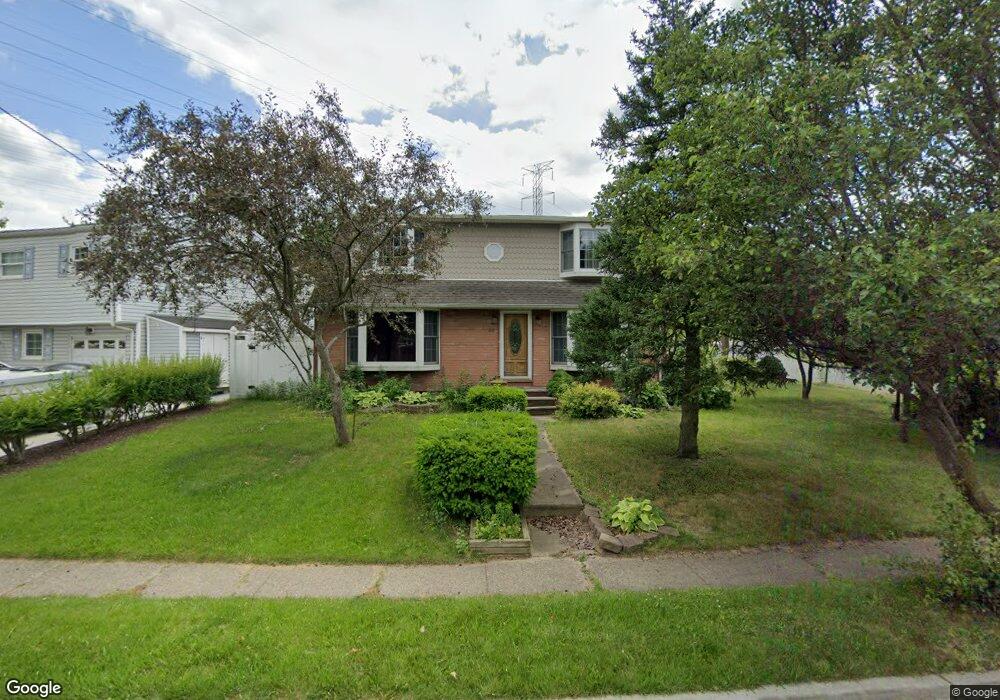
89 Pupek Rd South Amboy, NJ 08879
Estimated Value: $461,186 - $526,000
3
Beds
2
Baths
1,468
Sq Ft
$336/Sq Ft
Est. Value
About This Home
This home is located at 89 Pupek Rd, South Amboy, NJ 08879 and is currently estimated at $493,047, approximately $335 per square foot. 89 Pupek Rd is a home located in Middlesex County with nearby schools including South Amboy Elementary School, South Amboy Middle/High School, and St. Mary Elementary School.
Ownership History
Date
Name
Owned For
Owner Type
Purchase Details
Closed on
Jan 26, 2011
Sold by
Beneficial Financial 1
Bought by
Wang Yuan
Current Estimated Value
Home Financials for this Owner
Home Financials are based on the most recent Mortgage that was taken out on this home.
Original Mortgage
$148,800
Interest Rate
4.99%
Mortgage Type
New Conventional
Purchase Details
Closed on
Nov 3, 2010
Sold by
Brezezinski Robert and Brzezinski Theresa
Bought by
Beneficial New Jersey Inc
Create a Home Valuation Report for This Property
The Home Valuation Report is an in-depth analysis detailing your home's value as well as a comparison with similar homes in the area
Home Values in the Area
Average Home Value in this Area
Purchase History
| Date | Buyer | Sale Price | Title Company |
|---|---|---|---|
| Wang Yuan | $186,000 | First American Title Ins Co | |
| Beneficial New Jersey Inc | -- | None Available |
Source: Public Records
Mortgage History
| Date | Status | Borrower | Loan Amount |
|---|---|---|---|
| Open | Wang Yuan | $18,000 | |
| Previous Owner | Wang Yuan | $148,800 |
Source: Public Records
Tax History Compared to Growth
Tax History
| Year | Tax Paid | Tax Assessment Tax Assessment Total Assessment is a certain percentage of the fair market value that is determined by local assessors to be the total taxable value of land and additions on the property. | Land | Improvement |
|---|---|---|---|---|
| 2025 | $8,443 | $263,100 | $139,900 | $123,200 |
| 2024 | $8,125 | $263,100 | $139,900 | $123,200 |
| 2023 | $8,125 | $263,100 | $139,900 | $123,200 |
| 2022 | $7,719 | $263,100 | $139,900 | $123,200 |
| 2021 | $7,590 | $263,100 | $139,900 | $123,200 |
| 2020 | $7,412 | $263,100 | $139,900 | $123,200 |
| 2019 | $7,293 | $263,100 | $139,900 | $123,200 |
| 2018 | $7,233 | $263,100 | $139,900 | $123,200 |
| 2017 | $7,117 | $263,100 | $139,900 | $123,200 |
| 2016 | $6,938 | $263,100 | $139,900 | $123,200 |
| 2015 | $6,988 | $263,100 | $139,900 | $123,200 |
| 2014 | $6,749 | $263,100 | $139,900 | $123,200 |
Source: Public Records
Map
Nearby Homes