Estimated Value: $482,000 - $567,000
4
Beds
2
Baths
2,126
Sq Ft
$253/Sq Ft
Est. Value
About This Home
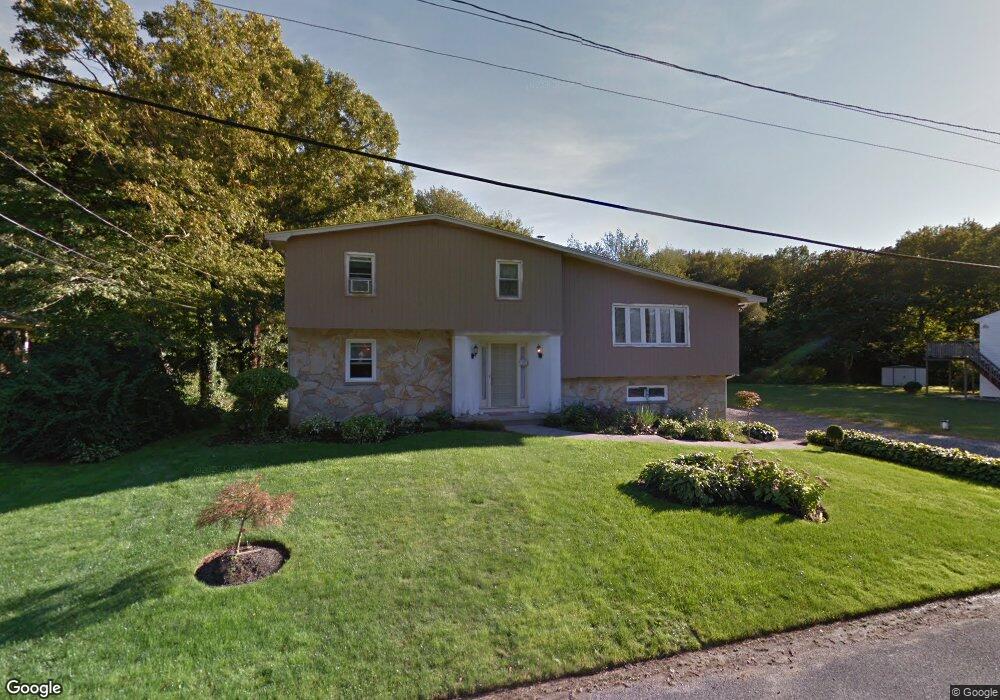
This home is located at 89 R Dr, Westport, MA 02790 and is currently estimated at $537,496, approximately $252 per square foot. 89 R Dr is a home located in Bristol County with nearby schools including Alice A. Macomber Primary School, Westport Elementary School, and Westport Middle-High School.
Ownership History
Date
Name
Owned For
Owner Type
Purchase Details
Closed on
Oct 9, 2009
Sold by
Whitehead-Murphy Susan P
Bought by
Conceicao Agripina P and Conceicao Humberto A
Current Estimated Value
Purchase Details
Closed on
Nov 16, 2007
Sold by
Whitehead Susan P
Bought by
Whitehead-Murphy Susan P
Purchase Details
Closed on
Apr 7, 2004
Sold by
Whitehead Susan P
Bought by
Whitehead Brandon and Whitehead Candace
Create a Home Valuation Report for This Property
The Home Valuation Report is an in-depth analysis detailing your home's value as well as a comparison with similar homes in the area
Home Values in the Area
Average Home Value in this Area
Purchase History
| Date | Buyer | Sale Price | Title Company |
|---|---|---|---|
| Conceicao Agripina P | $220,000 | -- | |
| Whitehead-Murphy Susan P | -- | -- | |
| Whitehead Brandon | -- | -- |
Source: Public Records
Mortgage History
| Date | Status | Borrower | Loan Amount |
|---|---|---|---|
| Previous Owner | Whitehead Brandon | $313,600 |
Source: Public Records
Tax History Compared to Growth
Tax History
| Year | Tax Paid | Tax Assessment Tax Assessment Total Assessment is a certain percentage of the fair market value that is determined by local assessors to be the total taxable value of land and additions on the property. | Land | Improvement |
|---|---|---|---|---|
| 2025 | $3,141 | $421,600 | $164,300 | $257,300 |
| 2024 | $3,121 | $403,800 | $152,200 | $251,600 |
| 2023 | $3,076 | $377,000 | $138,600 | $238,400 |
| 2022 | $2,782 | $335,700 | $126,000 | $209,700 |
| 2021 | $2,782 | $322,700 | $114,600 | $208,100 |
| 2020 | $2,682 | $318,100 | $110,000 | $208,100 |
| 2019 | $2,456 | $297,000 | $110,000 | $187,000 |
| 2018 | $2,424 | $296,700 | $111,000 | $185,700 |
| 2017 | $2,363 | $296,500 | $107,500 | $189,000 |
| 2016 | $2,322 | $293,500 | $104,000 | $189,500 |
| 2015 | $2,225 | $280,600 | $106,300 | $174,300 |
Source: Public Records
Map
Nearby Homes