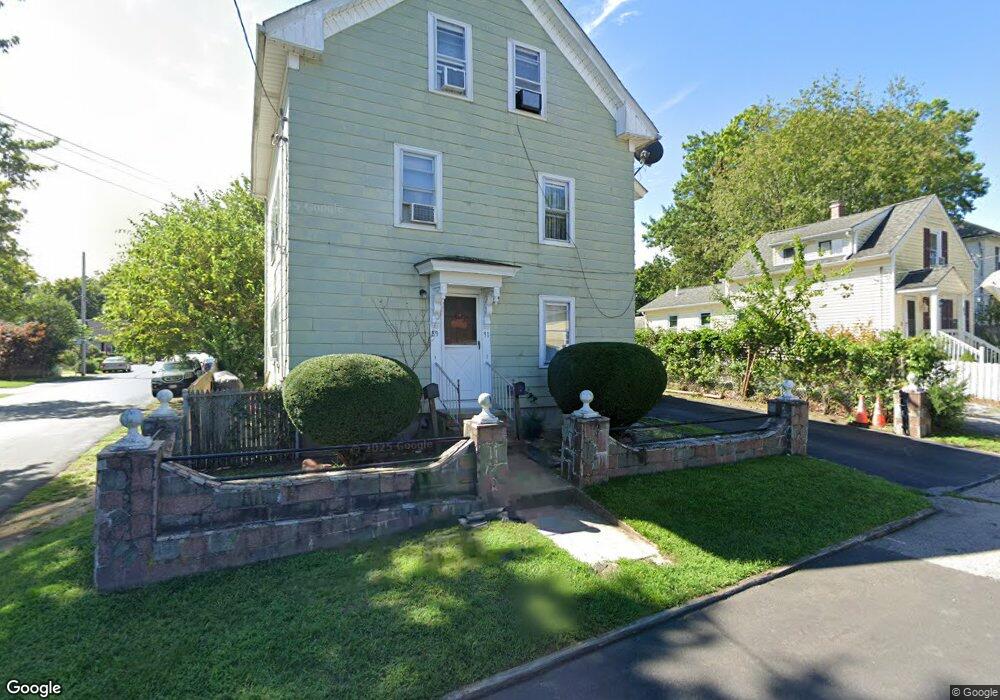
89 River St Unit 91 Riverside, RI 02915
Riverside NeighborhoodEstimated Value: $425,000 - $606,000
7
Beds
2
Baths
1,651
Sq Ft
$302/Sq Ft
Est. Value
About This Home
This home is located at 89 River St Unit 91, Riverside, RI 02915 and is currently estimated at $498,794, approximately $302 per square foot. 89 River St Unit 91 is a home located in Providence County with nearby schools including East Providence High School, St Mary Academy-Bay View, and St Luke Elementary School.
Ownership History
Date
Name
Owned For
Owner Type
Purchase Details
Closed on
Aug 29, 2002
Sold by
Francisco Jack and Francisco Juliet
Bought by
Rodrigues Laurino G and Rodrigues Antoinette
Current Estimated Value
Home Financials for this Owner
Home Financials are based on the most recent Mortgage that was taken out on this home.
Original Mortgage
$162,352
Outstanding Balance
$66,051
Interest Rate
6.55%
Mortgage Type
Purchase Money Mortgage
Estimated Equity
$432,743
Purchase Details
Closed on
Apr 3, 1992
Sold by
Rizzo Gertrude M
Bought by
Francisco Jack
Create a Home Valuation Report for This Property
The Home Valuation Report is an in-depth analysis detailing your home's value as well as a comparison with similar homes in the area
Home Values in the Area
Average Home Value in this Area
Purchase History
| Date | Buyer | Sale Price | Title Company |
|---|---|---|---|
| Rodrigues Laurino G | $165,000 | -- | |
| Rodrigues Laurino G | $165,000 | -- | |
| Francisco Jack | $75,000 | -- | |
| Francisco Jack | $75,000 | -- |
Source: Public Records
Mortgage History
| Date | Status | Borrower | Loan Amount |
|---|---|---|---|
| Open | Francisco Jack | $162,352 | |
| Closed | Francisco Jack | $162,352 |
Source: Public Records
Tax History
| Year | Tax Paid | Tax Assessment Tax Assessment Total Assessment is a certain percentage of the fair market value that is determined by local assessors to be the total taxable value of land and additions on the property. | Land | Improvement |
|---|---|---|---|---|
| 2025 | $5,357 | $409,900 | $102,000 | $307,900 |
| 2024 | $4,608 | $300,600 | $85,000 | $215,600 |
| 2023 | $4,437 | $300,600 | $85,000 | $215,600 |
| 2022 | $4,540 | $207,700 | $54,400 | $153,300 |
| 2021 | $4,466 | $207,700 | $54,400 | $153,300 |
| 2020 | $4,277 | $207,700 | $54,400 | $153,300 |
| 2019 | $4,158 | $207,700 | $54,400 | $153,300 |
| 2018 | $3,336 | $145,800 | $36,700 | $109,100 |
| 2017 | $3,262 | $145,800 | $36,700 | $109,100 |
| 2016 | $3,246 | $145,800 | $36,700 | $109,100 |
| 2015 | $3,477 | $151,500 | $36,400 | $115,100 |
| 2014 | $3,477 | $151,500 | $36,400 | $115,100 |
Source: Public Records
Map
Nearby Homes
- 72 Stowe Ave
- 41 White Ave
- 33 Pine St Unit 35
- 103 Burnside Ave
- 129 Shore Rd
- 14 Winthrop St
- 10 Booth Ave
- 15 Claire St
- 28 Jefferson Ave
- 14 Benedict St
- 25 Winslow St
- 25 Arnold St
- 0 Carousel Dr
- 151 Willett Ave Unit 2
- 85 Hilton Ave
- 916 Bullocks Pt Ave
- 43 Bullocks Point Ave Unit 4A
- 33 Bullocks Point Ave Unit 5C
- 25 Bullocks Point Ave Unit 5C
- 15 Plaza Dr
Your Personal Tour Guide
Ask me questions while you tour the home.