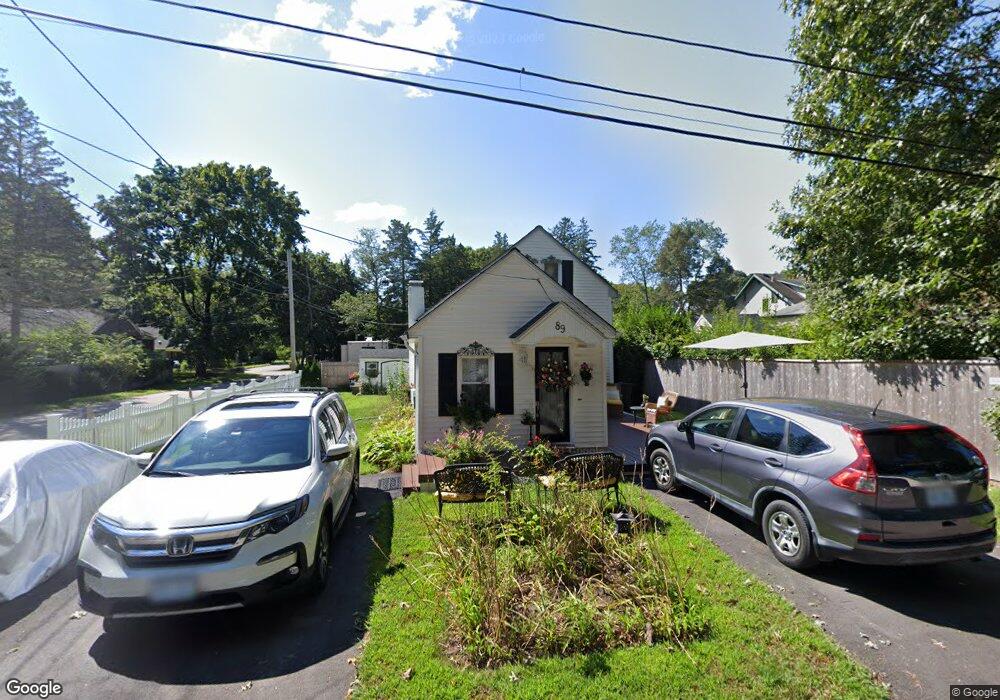
89 Rogers Ave Barrington, RI 02806
North Barrington NeighborhoodEstimated Value: $434,000 - $518,000
2
Beds
1
Bath
1,040
Sq Ft
$448/Sq Ft
Est. Value
About This Home
This home is located at 89 Rogers Ave, Barrington, RI 02806 and is currently estimated at $465,763, approximately $447 per square foot. 89 Rogers Ave is a home located in Bristol County with nearby schools including Barrington High School, St Luke Elementary School, and Barrington Christian Academy.
Ownership History
Date
Name
Owned For
Owner Type
Purchase Details
Closed on
Sep 21, 2004
Sold by
Floderus Sari and Darmody John
Bought by
Lombari Linda
Current Estimated Value
Purchase Details
Closed on
Nov 26, 1993
Sold by
Smith Russell L
Bought by
Floderus Sari K
Purchase Details
Closed on
Jun 21, 1991
Sold by
Green Barbara E
Bought by
Smith Russell L
Create a Home Valuation Report for This Property
The Home Valuation Report is an in-depth analysis detailing your home's value as well as a comparison with similar homes in the area
Home Values in the Area
Average Home Value in this Area
Purchase History
| Date | Buyer | Sale Price | Title Company |
|---|---|---|---|
| Lombari Linda | $234,000 | -- | |
| Floderus Sari K | $103,500 | -- | |
| Smith Russell L | $52,000 | -- | |
| Smith Russell L | $52,000 | -- |
Source: Public Records
Mortgage History
| Date | Status | Borrower | Loan Amount |
|---|---|---|---|
| Open | Smith Russell L | $134,000 | |
| Closed | Smith Russell L | $13,000 |
Source: Public Records
Tax History Compared to Growth
Tax History
| Year | Tax Paid | Tax Assessment Tax Assessment Total Assessment is a certain percentage of the fair market value that is determined by local assessors to be the total taxable value of land and additions on the property. | Land | Improvement |
|---|---|---|---|---|
| 2025 | $5,492 | $358,000 | $212,000 | $146,000 |
| 2024 | $5,281 | $358,000 | $212,000 | $146,000 |
| 2023 | $4,953 | $244,000 | $118,000 | $126,000 |
| 2022 | $4,795 | $244,000 | $118,000 | $126,000 |
| 2021 | $4,673 | $244,000 | $118,000 | $126,000 |
| 2020 | $4,514 | $216,000 | $100,000 | $116,000 |
| 2019 | $4,342 | $216,000 | $100,000 | $116,000 |
| 2018 | $4,212 | $216,000 | $100,000 | $116,000 |
| 2017 | $4,038 | $201,900 | $99,100 | $102,800 |
| 2016 | $3,725 | $201,900 | $99,100 | $102,800 |
| 2015 | $3,685 | $201,900 | $99,100 | $102,800 |
| 2014 | $3,792 | $207,200 | $101,100 | $106,100 |
Source: Public Records
Map
Nearby Homes
- 140 Promenade St
- 45 Washington Rd
- 25 Park Square Ave
- 85 Hilton Ave
- 5 Booth Ave
- 29 Lake Ave
- 27 Rosedale Ave
- 6 Hilton Ave
- 164 Bay Spring Ave
- 146 Becker Ave
- 81 Pine Crest Dr
- 83 Pine Crest Dr
- 0 Bogman Rd
- 4 Spinnaker Dr
- 0 Carousel Dr
- 16 Highview Ave
- 20 Townsend St
- 7 Carpenter Ave
- 735 Willett Ave Unit 806
- 41 White Ave