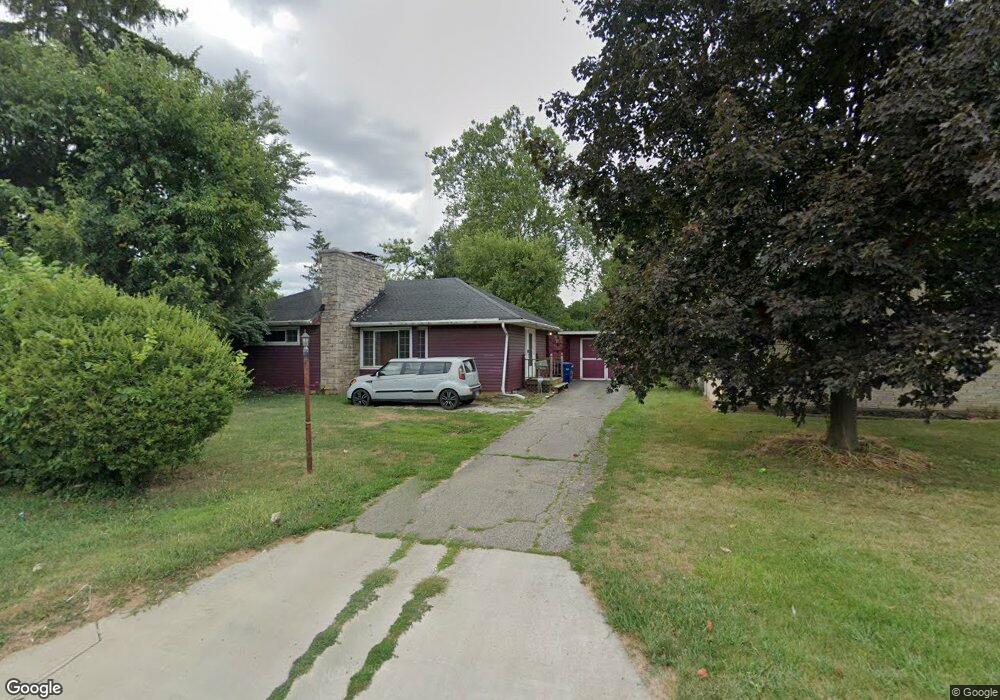
89 S James Rd Columbus, OH 43213
Eastmoor NeighborhoodEstimated Value: $180,000 - $225,000
2
Beds
2
Baths
913
Sq Ft
$228/Sq Ft
Est. Value
About This Home
This home is located at 89 S James Rd, Columbus, OH 43213 and is currently estimated at $208,544, approximately $228 per square foot. 89 S James Rd is a home located in Franklin County with nearby schools including Fairmoor Elementary School, Johnson Park Middle School, and Walnut Ridge High School.
Ownership History
Date
Name
Owned For
Owner Type
Purchase Details
Closed on
Oct 18, 2005
Sold by
Paetsch Matthew and Gentile Cristina
Bought by
Willard Stacey Earl and Pizzo Christopher John
Current Estimated Value
Home Financials for this Owner
Home Financials are based on the most recent Mortgage that was taken out on this home.
Original Mortgage
$78,400
Outstanding Balance
$42,212
Interest Rate
6.25%
Mortgage Type
Fannie Mae Freddie Mac
Estimated Equity
$166,332
Purchase Details
Closed on
Apr 29, 2002
Sold by
Kronmann Lisha C and Kronmann Karl C
Bought by
Paetsch Matthew and Gentile Cristina
Purchase Details
Closed on
Jun 10, 1997
Sold by
Wilkinson Mary E
Bought by
Kronmann Lisha C and Kronmann Karl C
Home Financials for this Owner
Home Financials are based on the most recent Mortgage that was taken out on this home.
Original Mortgage
$58,500
Interest Rate
8.13%
Purchase Details
Closed on
Jan 25, 1990
Create a Home Valuation Report for This Property
The Home Valuation Report is an in-depth analysis detailing your home's value as well as a comparison with similar homes in the area
Home Values in the Area
Average Home Value in this Area
Purchase History
| Date | Buyer | Sale Price | Title Company |
|---|---|---|---|
| Willard Stacey Earl | $98,000 | Ohio Land R | |
| Paetsch Matthew | $79,900 | Title First Agency Inc | |
| Kronmann Lisha C | $65,000 | -- | |
| -- | -- | -- |
Source: Public Records
Mortgage History
| Date | Status | Borrower | Loan Amount |
|---|---|---|---|
| Open | Willard Stacey Earl | $78,400 | |
| Previous Owner | Kronmann Lisha C | $58,500 |
Source: Public Records
Tax History
| Year | Tax Paid | Tax Assessment Tax Assessment Total Assessment is a certain percentage of the fair market value that is determined by local assessors to be the total taxable value of land and additions on the property. | Land | Improvement |
|---|---|---|---|---|
| 2025 | $5,118 | $77,880 | $41,900 | $35,980 |
| 2024 | $5,118 | $77,880 | $41,900 | $35,980 |
| 2023 | $3,451 | $77,875 | $41,895 | $35,980 |
| 2022 | $2,923 | $36,860 | $10,430 | $26,430 |
| 2021 | $1,915 | $36,860 | $10,430 | $26,430 |
| 2020 | $1,918 | $36,860 | $10,430 | $26,430 |
| 2019 | $1,767 | $29,130 | $8,370 | $20,760 |
| 2018 | $1,764 | $29,130 | $8,370 | $20,760 |
| 2017 | $1,766 | $29,130 | $8,370 | $20,760 |
| 2016 | $1,944 | $29,340 | $6,830 | $22,510 |
| 2015 | $1,764 | $29,340 | $6,830 | $22,510 |
| 2014 | $1,769 | $29,340 | $6,830 | $22,510 |
| 2013 | $872 | $29,330 | $6,825 | $22,505 |
Source: Public Records
Map
Nearby Homes
- 3191 E Broad St
- 181 S Kellner Rd
- 228 S Ashburton Rd
- 177 S Hampton Rd
- 277 S James Rd
- 279 S Ashburton Rd
- 73 N Everett Ave
- 290 S Hampton Rd
- 50 S Chesterfield Rd
- 181 S Weyant Ave
- 50 N Hampton Rd
- 73 N Hampton Rd
- 157 N Kellner Rd
- 350 S Hampton Rd
- 68 S Weyant Ave
- 194 N Kellner Rd
- 41 S Broadleigh Rd
- 180 N Harding Rd
- 430 S James Rd
- 238 Edgevale Rd
Your Personal Tour Guide
Ask me questions while you tour the home.