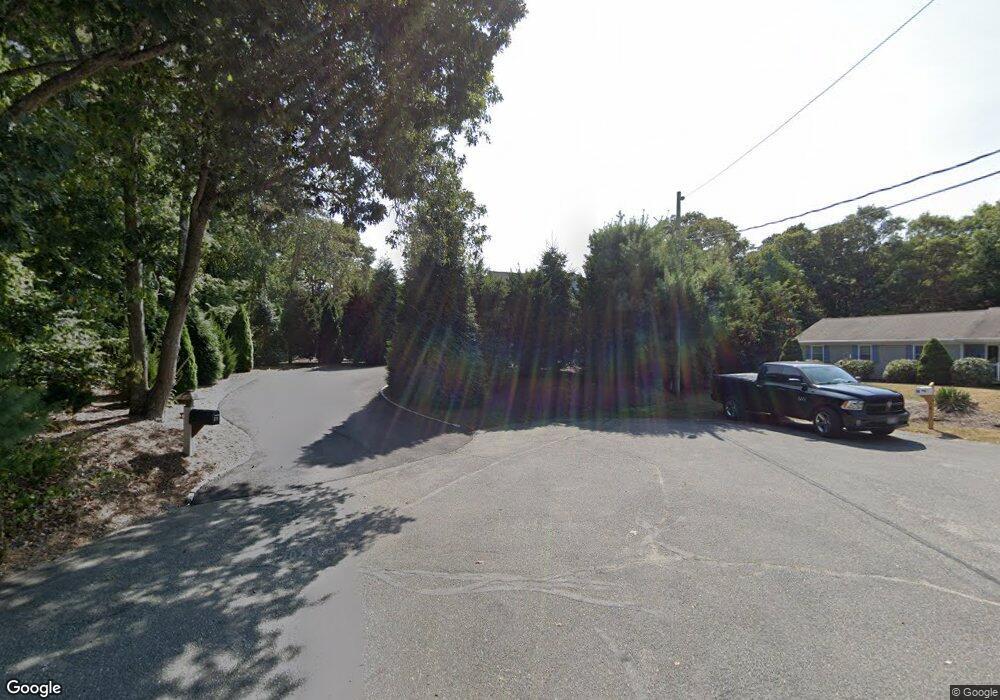
89 Tellegen Trail Centerville, MA 02632
Centerville NeighborhoodEstimated Value: $638,000 - $727,000
2
Beds
3
Baths
1,512
Sq Ft
$456/Sq Ft
Est. Value
About This Home
This home is located at 89 Tellegen Trail, Centerville, MA 02632 and is currently estimated at $689,580, approximately $456 per square foot. 89 Tellegen Trail is a home located in Barnstable County with nearby schools including Centerville Elementary School, Barnstable United Elementary School, and Barnstable Intermediate School.
Ownership History
Date
Name
Owned For
Owner Type
Purchase Details
Closed on
Feb 28, 2011
Sold by
Parisi Joanne
Bought by
Griffith Richard W
Current Estimated Value
Home Financials for this Owner
Home Financials are based on the most recent Mortgage that was taken out on this home.
Original Mortgage
$253,409
Outstanding Balance
$169,622
Interest Rate
4.25%
Mortgage Type
FHA
Estimated Equity
$519,958
Purchase Details
Closed on
Jul 19, 2010
Sold by
Iafrate Joseph D
Bought by
Parisi Joanne
Purchase Details
Closed on
Jul 9, 2008
Sold by
Tartaglia Ernest A
Bought by
Iafrate Joseph D
Home Financials for this Owner
Home Financials are based on the most recent Mortgage that was taken out on this home.
Original Mortgage
$250,000
Interest Rate
6.13%
Mortgage Type
Purchase Money Mortgage
Purchase Details
Closed on
Apr 28, 2008
Sold by
Laclaire Kathleen I and Myrick Kathleen I
Bought by
Tartaglia Ernest A
Create a Home Valuation Report for This Property
The Home Valuation Report is an in-depth analysis detailing your home's value as well as a comparison with similar homes in the area
Home Values in the Area
Average Home Value in this Area
Purchase History
| Date | Buyer | Sale Price | Title Company |
|---|---|---|---|
| Griffith Richard W | $260,000 | -- | |
| Parisi Joanne | $275,000 | -- | |
| Iafrate Joseph D | $57,460 | -- | |
| Tartaglia Ernest A | -- | -- |
Source: Public Records
Mortgage History
| Date | Status | Borrower | Loan Amount |
|---|---|---|---|
| Open | Griffith Richard W | $253,409 | |
| Previous Owner | Iafrate Joseph D | $250,000 |
Source: Public Records
Tax History
| Year | Tax Paid | Tax Assessment Tax Assessment Total Assessment is a certain percentage of the fair market value that is determined by local assessors to be the total taxable value of land and additions on the property. | Land | Improvement |
|---|---|---|---|---|
| 2025 | $5,025 | $621,100 | $140,800 | $480,300 |
| 2024 | $4,644 | $594,600 | $140,800 | $453,800 |
| 2023 | $4,483 | $537,500 | $135,200 | $402,300 |
| 2022 | $4,253 | $441,200 | $100,100 | $341,100 |
| 2021 | $4,076 | $388,600 | $94,800 | $293,800 |
| 2020 | $4,243 | $387,100 | $94,800 | $292,300 |
| 2019 | $3,934 | $348,800 | $89,600 | $259,200 |
| 2018 | $3,563 | $317,600 | $94,300 | $223,300 |
| 2017 | $3,064 | $284,800 | $72,100 | $212,700 |
| 2016 | $3,112 | $285,500 | $72,800 | $212,700 |
| 2015 | $2,927 | $269,800 | $71,300 | $198,500 |
Source: Public Records
Map
Nearby Homes
- 10 Sail a Way
- 10 Sail -A-way
- 83 Lake Dr
- 40 Sachem Dr
- 180 Pond View Dr
- 576 Strawberry Hill Rd
- 60 Richards Ln
- 290 Riverview Ln
- 140 Wequaquet Ln
- 19 Marrick Ct
- 481 Lakeside Dr W
- 156 S Main St
- 21 Brian Ln
- 82 Yacht Club Rd
- 357 Lakeside Dr W
- 33 Edgewood Rd
- 443 Elliott Rd
- 103 Pine Tree Dr
- 75 Olander Dr
- 75 Olander Dr
Your Personal Tour Guide
Ask me questions while you tour the home.