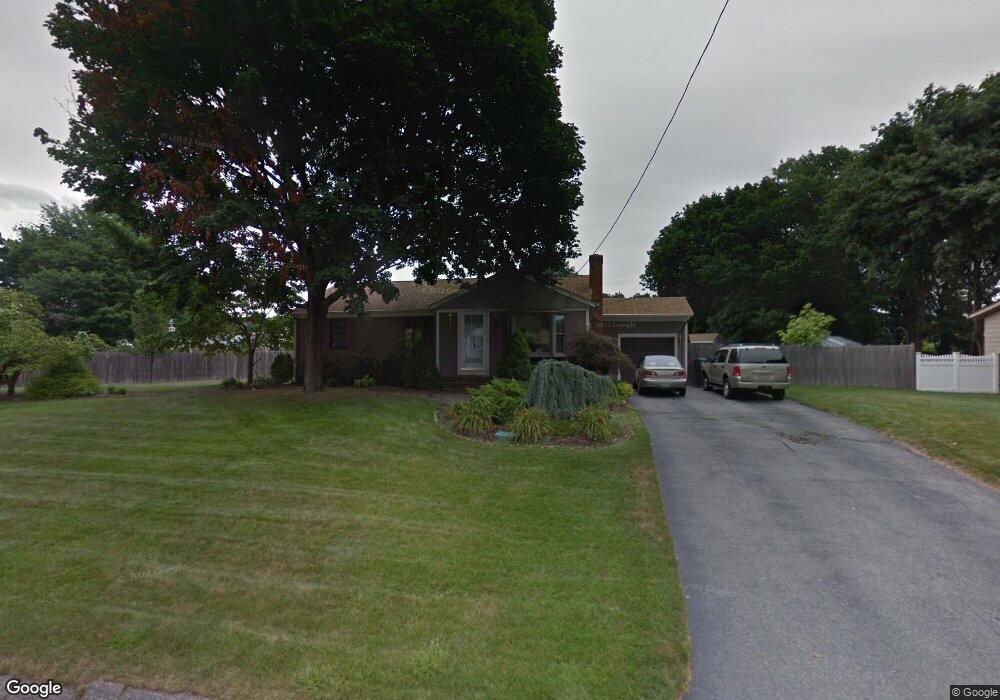
89 Thrush Rd Warwick, RI 02886
Greenwood NeighborhoodEstimated Value: $410,560 - $535,000
2
Beds
2
Baths
1,040
Sq Ft
$440/Sq Ft
Est. Value
About This Home
This home is located at 89 Thrush Rd, Warwick, RI 02886 and is currently estimated at $457,140, approximately $439 per square foot. 89 Thrush Rd is a home located in Kent County with nearby schools including St Rose Of Lima School, Islamic School of Rhode Island, and St Joseph School.
Ownership History
Date
Name
Owned For
Owner Type
Purchase Details
Closed on
Jun 26, 1997
Sold by
Quaglieri Ronald and Quaglieri Jacqueline
Bought by
Biscardi Salvatore and Biscardi Christine
Current Estimated Value
Home Financials for this Owner
Home Financials are based on the most recent Mortgage that was taken out on this home.
Original Mortgage
$100,000
Outstanding Balance
$13,472
Interest Rate
7.81%
Mortgage Type
Purchase Money Mortgage
Estimated Equity
$443,668
Create a Home Valuation Report for This Property
The Home Valuation Report is an in-depth analysis detailing your home's value as well as a comparison with similar homes in the area
Home Values in the Area
Average Home Value in this Area
Purchase History
| Date | Buyer | Sale Price | Title Company |
|---|---|---|---|
| Biscardi Salvatore | $135,000 | -- |
Source: Public Records
Mortgage History
| Date | Status | Borrower | Loan Amount |
|---|---|---|---|
| Open | Biscardi Salvatore | $23,400 | |
| Open | Biscardi Salvatore | $100,000 |
Source: Public Records
Tax History
| Year | Tax Paid | Tax Assessment Tax Assessment Total Assessment is a certain percentage of the fair market value that is determined by local assessors to be the total taxable value of land and additions on the property. | Land | Improvement |
|---|---|---|---|---|
| 2025 | $5,250 | $413,400 | $121,800 | $291,600 |
| 2024 | $4,586 | $316,900 | $105,900 | $211,000 |
| 2023 | $4,457 | $314,100 | $105,900 | $208,200 |
| 2022 | $4,297 | $229,400 | $71,100 | $158,300 |
| 2021 | $4,297 | $229,400 | $71,100 | $158,300 |
| 2020 | $4,297 | $229,400 | $71,100 | $158,300 |
| 2019 | $4,297 | $229,400 | $71,100 | $158,300 |
| 2018 | $3,929 | $188,900 | $78,300 | $110,600 |
| 2017 | $3,823 | $188,900 | $78,300 | $110,600 |
| 2016 | $3,823 | $188,900 | $78,300 | $110,600 |
| 2015 | $3,677 | $177,200 | $70,500 | $106,700 |
| 2014 | $3,555 | $177,200 | $70,500 | $106,700 |
| 2013 | $3,507 | $177,200 | $70,500 | $106,700 |
Source: Public Records
Map
Nearby Homes
- 892 Halifax Dr
- 69 Haverhill Ave
- 123 Edman St
- 115 Edman St
- 833 Halifax Dr
- 122 Edaville Ct
- 6 Lillian Ct
- 333 Greenwood Ave
- 14 W Natick Rd
- 165 Graystone St
- 5 High St
- 143 Morse Ave
- 16 Flynn Ave
- 233 Palace Ave
- 27 Great Oak Dr
- 139 Lancaster Ave
- 36 Great Oak Dr
- 2907 Post Rd Unit 2
- 2907 Post Rd Unit 3
- 10 East St Unit 316
Your Personal Tour Guide
Ask me questions while you tour the home.