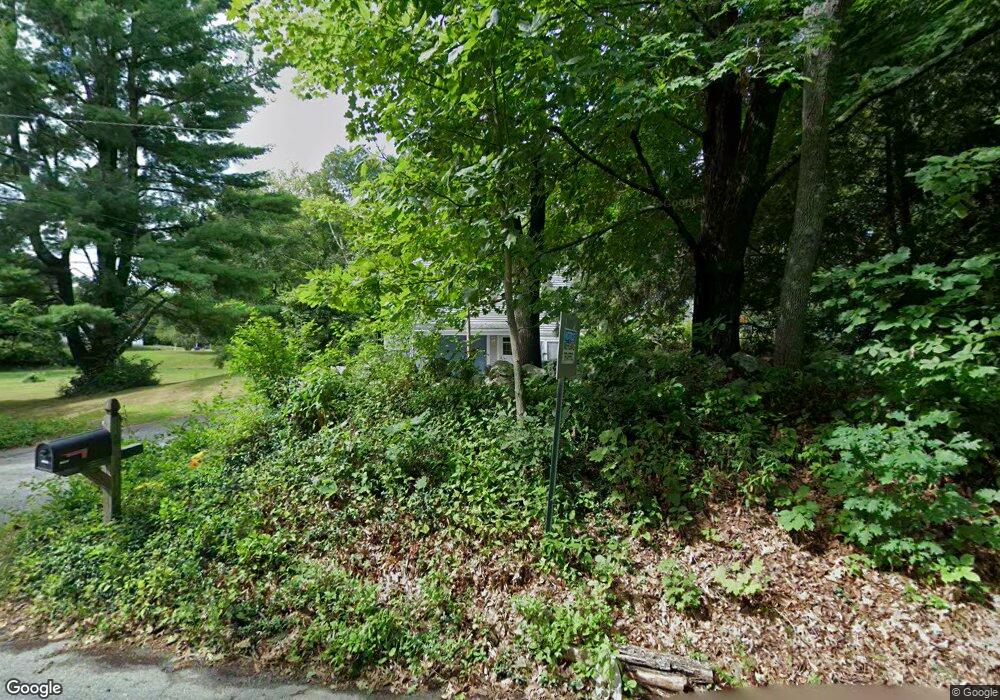
89 W Bacon St Plainville, MA 02762
Estimated Value: $522,532 - $596,000
3
Beds
2
Baths
1,132
Sq Ft
$491/Sq Ft
Est. Value
About This Home
This home is located at 89 W Bacon St, Plainville, MA 02762 and is currently estimated at $555,633, approximately $490 per square foot. 89 W Bacon St is a home located in Norfolk County with nearby schools including Anna Ware Jackson School, Beatrice H. Wood Elementary School, and Cadence Academy Preschool - North Attleborough.
Ownership History
Date
Name
Owned For
Owner Type
Purchase Details
Closed on
Aug 20, 2001
Sold by
Hennessey James F and Hennessey June C
Bought by
Popovsky Lazo Z and Popovsky Regina M
Current Estimated Value
Home Financials for this Owner
Home Financials are based on the most recent Mortgage that was taken out on this home.
Original Mortgage
$97,000
Outstanding Balance
$37,865
Interest Rate
7.16%
Mortgage Type
Purchase Money Mortgage
Estimated Equity
$517,768
Create a Home Valuation Report for This Property
The Home Valuation Report is an in-depth analysis detailing your home's value as well as a comparison with similar homes in the area
Home Values in the Area
Average Home Value in this Area
Purchase History
| Date | Buyer | Sale Price | Title Company |
|---|---|---|---|
| Popovsky Lazo Z | $246,900 | -- |
Source: Public Records
Mortgage History
| Date | Status | Borrower | Loan Amount |
|---|---|---|---|
| Open | Popovsky Lazo Z | $97,000 |
Source: Public Records
Tax History Compared to Growth
Tax History
| Year | Tax Paid | Tax Assessment Tax Assessment Total Assessment is a certain percentage of the fair market value that is determined by local assessors to be the total taxable value of land and additions on the property. | Land | Improvement |
|---|---|---|---|---|
| 2025 | $47 | $410,600 | $216,600 | $194,000 |
| 2024 | $4,566 | $380,500 | $197,000 | $183,500 |
| 2023 | $4,591 | $367,900 | $197,000 | $170,900 |
| 2022 | $4,495 | $320,400 | $189,000 | $131,400 |
| 2021 | $4,541 | $308,900 | $189,000 | $119,900 |
| 2020 | $4,575 | $311,200 | $189,000 | $122,200 |
| 2019 | $4,650 | $310,600 | $189,000 | $121,600 |
| 2018 | $4,464 | $296,400 | $170,400 | $126,000 |
| 2017 | $4,266 | $284,400 | $170,400 | $114,000 |
| 2016 | $4,268 | $287,800 | $170,400 | $117,400 |
| 2015 | $3,951 | $256,200 | $145,700 | $110,500 |
| 2014 | $3,854 | $257,600 | $145,700 | $111,900 |
Source: Public Records
Map
Nearby Homes