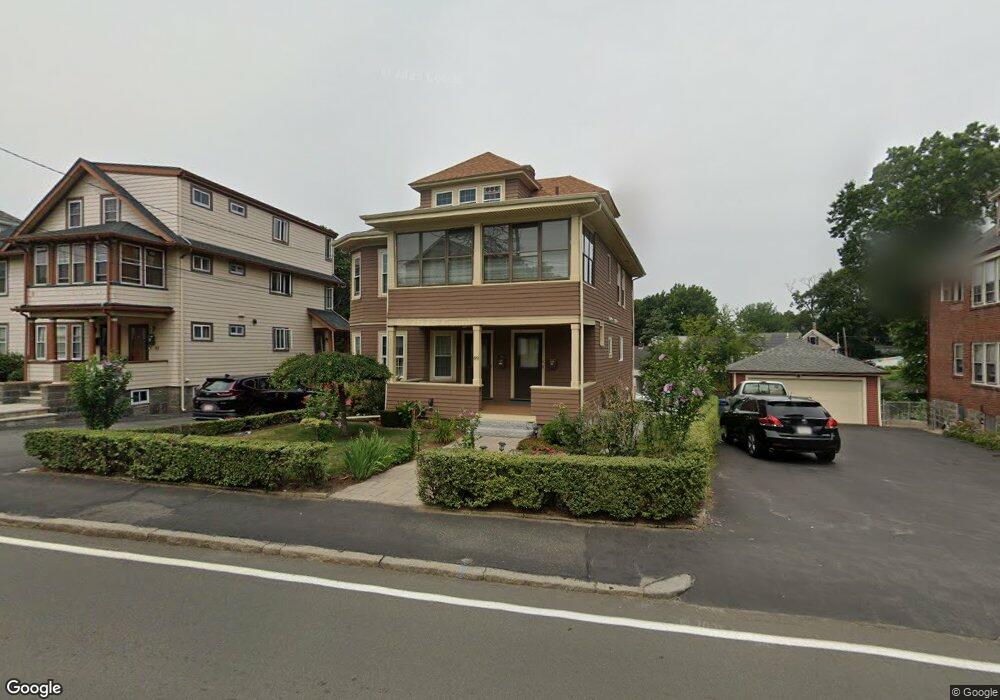
89 West St Quincy, MA 02169
South Quincy NeighborhoodEstimated Value: $903,000 - $974,000
4
Beds
2
Baths
2,363
Sq Ft
$396/Sq Ft
Est. Value
About This Home
This home is located at 89 West St, Quincy, MA 02169 and is currently estimated at $935,249, approximately $395 per square foot. 89 West St is a home located in Norfolk County with nearby schools including South West Middle School, Lincoln-Hancock Community School, and Quincy High School.
Ownership History
Date
Name
Owned For
Owner Type
Purchase Details
Closed on
Apr 29, 2019
Sold by
Esteves M Lucilia
Bought by
Esteves Maria L and Cruz Antonio A
Current Estimated Value
Purchase Details
Closed on
Jun 15, 1988
Sold by
Ferrante Miriam M
Bought by
Esteves Licinio M
Home Financials for this Owner
Home Financials are based on the most recent Mortgage that was taken out on this home.
Original Mortgage
$150,000
Interest Rate
10.24%
Mortgage Type
Purchase Money Mortgage
Create a Home Valuation Report for This Property
The Home Valuation Report is an in-depth analysis detailing your home's value as well as a comparison with similar homes in the area
Home Values in the Area
Average Home Value in this Area
Purchase History
| Date | Buyer | Sale Price | Title Company |
|---|---|---|---|
| Esteves Maria L | -- | -- | |
| Esteves Licinio M | $190,000 | -- |
Source: Public Records
Mortgage History
| Date | Status | Borrower | Loan Amount |
|---|---|---|---|
| Previous Owner | Esteves Licinio M | $101,720 | |
| Previous Owner | Esteves Licinio M | $150,000 |
Source: Public Records
Tax History Compared to Growth
Tax History
| Year | Tax Paid | Tax Assessment Tax Assessment Total Assessment is a certain percentage of the fair market value that is determined by local assessors to be the total taxable value of land and additions on the property. | Land | Improvement |
|---|---|---|---|---|
| 2025 | $9,798 | $849,800 | $318,700 | $531,100 |
| 2024 | $9,232 | $819,200 | $303,900 | $515,300 |
| 2023 | $8,642 | $776,500 | $277,100 | $499,400 |
| 2022 | $8,467 | $706,800 | $232,300 | $474,500 |
| 2021 | $8,466 | $697,400 | $232,300 | $465,100 |
| 2020 | $8,609 | $692,600 | $232,300 | $460,300 |
| 2019 | $8,206 | $653,900 | $219,700 | $434,200 |
| 2018 | $7,600 | $569,700 | $204,100 | $365,600 |
| 2017 | $7,663 | $540,800 | $194,700 | $346,100 |
| 2016 | $6,732 | $468,800 | $170,500 | $298,300 |
| 2015 | $6,621 | $453,500 | $170,500 | $283,000 |
| 2014 | $5,836 | $392,700 | $170,500 | $222,200 |
Source: Public Records
Map
Nearby Homes
- 42 West St
- 510 Willard St
- 211 West St Unit 12B
- 211 Copeland St
- 57 Buckley St
- 46-48 Buckley St
- 52 Bunker Hill Ln
- 14 Arthur Ave
- 12 Arthur Ave
- 21 Arthur St
- 46 Suomi Rd
- 46 Suomi Rd Unit 46
- 63 Adele Rd
- 91 Garfield St
- 64 Garfield St Unit B
- 1 Cityview Ln Unit 506
- 1 Cityview Ln Unit 210
- 1 Cityview Ln Unit 709
- 1 Cityview Ln Unit 204
- 21 Totman St Unit 202