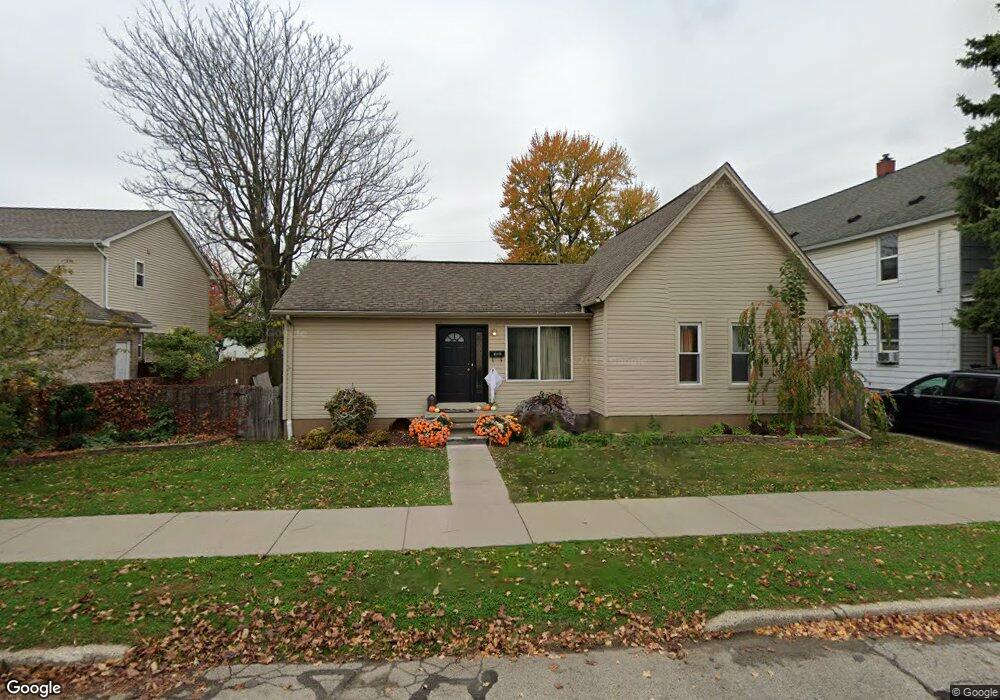
890 5th St Wyandotte, MI 48192
Estimated Value: $159,000 - $211,000
4
Beds
2
Baths
1,377
Sq Ft
$136/Sq Ft
Est. Value
About This Home
This home is located at 890 5th St, Wyandotte, MI 48192 and is currently estimated at $187,709, approximately $136 per square foot. 890 5th St is a home located in Wayne County with nearby schools including Jefferson Elementary School, Woodrow Wilson School, and Roosevelt High School.
Ownership History
Date
Name
Owned For
Owner Type
Purchase Details
Closed on
Apr 8, 2021
Sold by
Sandbox Property Management Llc
Bought by
Hasselbach Jesse
Current Estimated Value
Purchase Details
Closed on
Dec 20, 2019
Sold by
Garza Jason and Garza Christa
Bought by
Sandbox Property Management Llc
Purchase Details
Closed on
Aug 26, 2009
Sold by
Goodman Brad J and Goodman Robin
Bought by
Garza Jason
Purchase Details
Closed on
Mar 11, 2005
Sold by
Goodman Rene and Goodman Bruce G
Bought by
Goodman Brad J
Create a Home Valuation Report for This Property
The Home Valuation Report is an in-depth analysis detailing your home's value as well as a comparison with similar homes in the area
Home Values in the Area
Average Home Value in this Area
Purchase History
| Date | Buyer | Sale Price | Title Company |
|---|---|---|---|
| Hasselbach Jesse | $120,000 | Speedy T&E Services Llc | |
| Sandbox Property Management Llc | $95,000 | Speedy T&E Svcs Llc | |
| Garza Jason | $74,200 | Michigan Title Insurance Age | |
| Goodman Brad J | $45,000 | Multiple |
Source: Public Records
Tax History Compared to Growth
Tax History
| Year | Tax Paid | Tax Assessment Tax Assessment Total Assessment is a certain percentage of the fair market value that is determined by local assessors to be the total taxable value of land and additions on the property. | Land | Improvement |
|---|---|---|---|---|
| 2025 | $3,366 | $96,300 | $0 | $0 |
| 2024 | $3,366 | $84,300 | $0 | $0 |
| 2023 | $3,148 | $75,700 | $0 | $0 |
| 2022 | $3,646 | $67,600 | $0 | $0 |
| 2021 | $2,868 | $58,800 | $0 | $0 |
| 2020 | $3,770 | $51,800 | $0 | $0 |
| 2019 | $3,231 | $50,800 | $0 | $0 |
| 2018 | $2,330 | $47,600 | $0 | $0 |
| 2017 | $1,618 | $47,600 | $0 | $0 |
| 2016 | $3,105 | $47,600 | $0 | $0 |
| 2015 | $4,181 | $44,200 | $0 | $0 |
| 2013 | $4,050 | $40,500 | $0 | $0 |
| 2012 | $1,893 | $42,400 | $10,700 | $31,700 |
Source: Public Records
Map
Nearby Homes