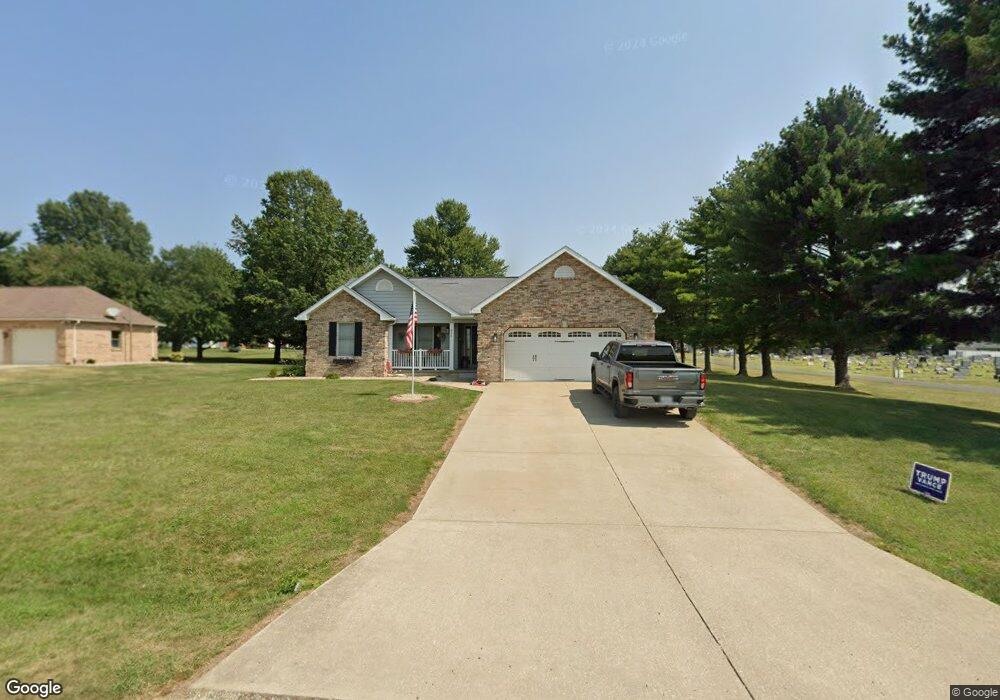
890 8th St Carrollton, IL 62016
Estimated Value: $120,000 - $221,821
4
Beds
3
Baths
1,517
Sq Ft
$107/Sq Ft
Est. Value
About This Home
This home is located at 890 8th St, Carrollton, IL 62016 and is currently estimated at $161,705, approximately $106 per square foot. 890 8th St is a home located in Greene County with nearby schools including Carrollton Grade School, Carrollton High School, and St. John the Evangelist School.
Ownership History
Date
Name
Owned For
Owner Type
Purchase Details
Closed on
Jul 25, 2013
Sold by
Shaw Brock M and Shaw Jennifer M
Bought by
Nichols Lori A
Current Estimated Value
Home Financials for this Owner
Home Financials are based on the most recent Mortgage that was taken out on this home.
Original Mortgage
$125,000
Outstanding Balance
$93,044
Interest Rate
4.49%
Mortgage Type
New Conventional
Estimated Equity
$68,661
Purchase Details
Closed on
Aug 4, 2008
Sold by
Barry Michael O and Barry Carolyn J
Bought by
Shaw Brock M and Shaw Jennifer M
Create a Home Valuation Report for This Property
The Home Valuation Report is an in-depth analysis detailing your home's value as well as a comparison with similar homes in the area
Home Values in the Area
Average Home Value in this Area
Purchase History
| Date | Buyer | Sale Price | Title Company |
|---|---|---|---|
| Nichols Lori A | -- | -- | |
| Shaw Brock M | -- | -- |
Source: Public Records
Mortgage History
| Date | Status | Borrower | Loan Amount |
|---|---|---|---|
| Open | Nichols Lori A | $125,000 |
Source: Public Records
Tax History Compared to Growth
Tax History
| Year | Tax Paid | Tax Assessment Tax Assessment Total Assessment is a certain percentage of the fair market value that is determined by local assessors to be the total taxable value of land and additions on the property. | Land | Improvement |
|---|---|---|---|---|
| 2024 | $3,475 | $57,565 | $3,588 | $53,977 |
| 2023 | $3,413 | $55,149 | $3,437 | $51,712 |
| 2022 | $3,788 | $58,375 | $8,179 | $50,196 |
| 2021 | $3,762 | $57,326 | $8,032 | $49,294 |
| 2020 | $3,707 | $53,595 | $7,509 | $46,086 |
| 2019 | $3,669 | $50,900 | $7,509 | $43,391 |
| 2018 | $3,814 | $56,312 | $7,509 | $48,803 |
| 2017 | $3,859 | $56,312 | $7,509 | $48,803 |
| 2015 | $3,915 | $57,293 | $7,509 | $49,784 |
| 2012 | $3,708 | $50,426 | $0 | $0 |
Source: Public Records
Map
Nearby Homes