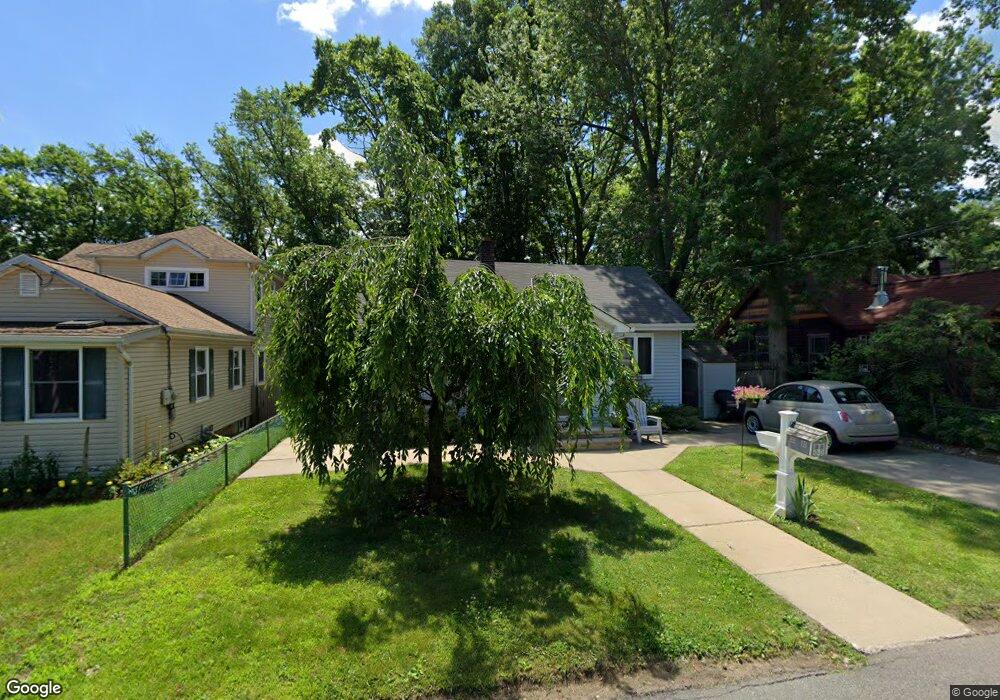
890 Grove Ave South Amboy, NJ 08879
Estimated Value: $381,021 - $437,000
3
Beds
1
Bath
1,170
Sq Ft
$342/Sq Ft
Est. Value
About This Home
This home is located at 890 Grove Ave, South Amboy, NJ 08879 and is currently estimated at $399,755, approximately $341 per square foot. 890 Grove Ave is a home located in Middlesex County with nearby schools including Old Bridge High School, Matawan Montessori Academy, and St. Joseph Elementary School.
Ownership History
Date
Name
Owned For
Owner Type
Purchase Details
Closed on
Jun 10, 2008
Current Estimated Value
Home Financials for this Owner
Home Financials are based on the most recent Mortgage that was taken out on this home.
Original Mortgage
$277,563
Outstanding Balance
$176,505
Interest Rate
6.13%
Mortgage Type
FHA
Estimated Equity
$223,250
Purchase Details
Closed on
Oct 23, 2002
Sold by
Sanchez Henry
Bought by
Torretta Michael
Home Financials for this Owner
Home Financials are based on the most recent Mortgage that was taken out on this home.
Original Mortgage
$166,500
Interest Rate
6.17%
Purchase Details
Closed on
Feb 23, 1999
Sold by
Malkiewicz Cheryl
Bought by
Sanchez Henry
Home Financials for this Owner
Home Financials are based on the most recent Mortgage that was taken out on this home.
Original Mortgage
$82,400
Interest Rate
6.78%
Create a Home Valuation Report for This Property
The Home Valuation Report is an in-depth analysis detailing your home's value as well as a comparison with similar homes in the area
Home Values in the Area
Average Home Value in this Area
Purchase History
| Date | Buyer | Sale Price | Title Company |
|---|---|---|---|
| -- | $281,900 | -- | |
| Dubina Brian | $281,920 | None Available | |
| Torretta Michael | $185,000 | -- | |
| Sanchez Henry | $103,000 | -- |
Source: Public Records
Mortgage History
| Date | Status | Borrower | Loan Amount |
|---|---|---|---|
| Open | Dubina Brian | $277,563 | |
| Closed | -- | $277,563 | |
| Previous Owner | Torretta Michael | $166,500 | |
| Previous Owner | Sanchez Henry | $82,400 |
Source: Public Records
Tax History Compared to Growth
Tax History
| Year | Tax Paid | Tax Assessment Tax Assessment Total Assessment is a certain percentage of the fair market value that is determined by local assessors to be the total taxable value of land and additions on the property. | Land | Improvement |
|---|---|---|---|---|
| 2025 | $5,425 | $94,700 | $40,000 | $54,700 |
| 2024 | $5,203 | $94,700 | $40,000 | $54,700 |
| 2023 | $5,203 | $94,700 | $40,000 | $54,700 |
| 2022 | $5,063 | $94,700 | $40,000 | $54,700 |
| 2021 | $4,969 | $94,700 | $40,000 | $54,700 |
| 2020 | $4,909 | $94,700 | $40,000 | $54,700 |
| 2019 | $4,831 | $94,700 | $40,000 | $54,700 |
| 2018 | $4,777 | $94,700 | $40,000 | $54,700 |
| 2017 | $4,628 | $94,700 | $40,000 | $54,700 |
| 2016 | $4,536 | $94,700 | $40,000 | $54,700 |
| 2015 | $4,457 | $94,700 | $40,000 | $54,700 |
| 2014 | $4,403 | $94,700 | $40,000 | $54,700 |
Source: Public Records
Map
Nearby Homes
- 940 Grove Ave
- 615 Greenwood Ave
- 737 Prospect Ave
- 438 Brookside Ave
- 250 Brookside Ave
- 169 Norwood Ave
- 146 Orchard Ave
- 181 Norwood Ave
- 429 Lea Ave
- 243 Alpine Way
- 239 Alpine Way
- 16 Harbor Bay Cir
- 107 Boulevard W
- 18 Bridgepointe Dr
- 18 Bridgepointe Dr Unit 207
- 106 Boulevard W
- 235 Garfield Ave
- 9 Rozalyn Ln Unit 131
- 9 Picaron Place Unit 46
- 301 Shoreland Cir