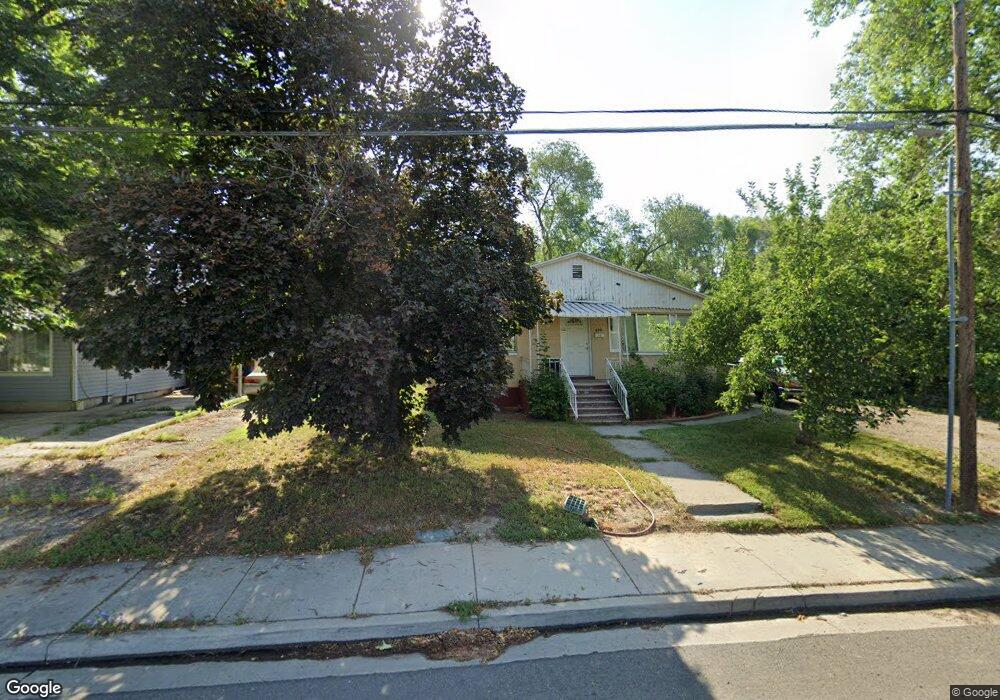
890 N 100 E Pleasant Grove, UT 84062
Estimated Value: $399,000 - $433,022
3
Beds
2
Baths
1,386
Sq Ft
$298/Sq Ft
Est. Value
About This Home
This home is located at 890 N 100 E, Pleasant Grove, UT 84062 and is currently estimated at $412,756, approximately $297 per square foot. 890 N 100 E is a home located in Utah County with nearby schools including Grovecrest Elementary School, Pleasant Grove Junior High School, and Pleasant Grove High School.
Ownership History
Date
Name
Owned For
Owner Type
Purchase Details
Closed on
Dec 27, 2007
Sold by
Kelly John
Bought by
Huff Dennis E
Current Estimated Value
Home Financials for this Owner
Home Financials are based on the most recent Mortgage that was taken out on this home.
Original Mortgage
$172,000
Outstanding Balance
$108,852
Interest Rate
6.21%
Mortgage Type
Purchase Money Mortgage
Estimated Equity
$303,904
Purchase Details
Closed on
Apr 14, 2006
Sold by
Madsen Boyd D
Bought by
Kelly John
Home Financials for this Owner
Home Financials are based on the most recent Mortgage that was taken out on this home.
Original Mortgage
$90,400
Interest Rate
6.29%
Mortgage Type
Fannie Mae Freddie Mac
Purchase Details
Closed on
Dec 2, 1996
Sold by
Alpine Management Inc
Bought by
Madsen Kathleen
Purchase Details
Closed on
Feb 14, 1995
Sold by
Sumsion Norma C and Sumsion Norma Ruth
Bought by
Sumsion Eldon Robert and Sumsion Sally
Create a Home Valuation Report for This Property
The Home Valuation Report is an in-depth analysis detailing your home's value as well as a comparison with similar homes in the area
Home Values in the Area
Average Home Value in this Area
Purchase History
| Date | Buyer | Sale Price | Title Company |
|---|---|---|---|
| Huff Dennis E | -- | Guardian Title Company Of U | |
| Kelly John | -- | Guardian Title Company Of U | |
| Madsen Kathleen | -- | -- | |
| Sumsion Eldon Robert | -- | -- |
Source: Public Records
Mortgage History
| Date | Status | Borrower | Loan Amount |
|---|---|---|---|
| Open | Huff Dennis E | $172,000 | |
| Previous Owner | Kelly John | $90,400 |
Source: Public Records
Tax History
| Year | Tax Paid | Tax Assessment Tax Assessment Total Assessment is a certain percentage of the fair market value that is determined by local assessors to be the total taxable value of land and additions on the property. | Land | Improvement |
|---|---|---|---|---|
| 2025 | $1,693 | $214,060 | -- | -- |
| 2024 | $1,693 | $202,070 | $0 | $0 |
| 2023 | $1,644 | $200,860 | $0 | $0 |
| 2022 | $1,856 | $225,665 | $0 | $0 |
| 2021 | $1,599 | $296,000 | $159,000 | $137,000 |
| 2020 | $1,469 | $266,500 | $142,000 | $124,500 |
| 2019 | $1,272 | $238,700 | $130,400 | $108,300 |
| 2018 | $1,203 | $213,400 | $118,900 | $94,500 |
| 2017 | $1,059 | $100,045 | $0 | $0 |
| 2016 | $1,020 | $93,060 | $0 | $0 |
| 2015 | $1,078 | $93,060 | $0 | $0 |
| 2014 | $1,002 | $85,690 | $0 | $0 |
Source: Public Records
Map
Nearby Homes