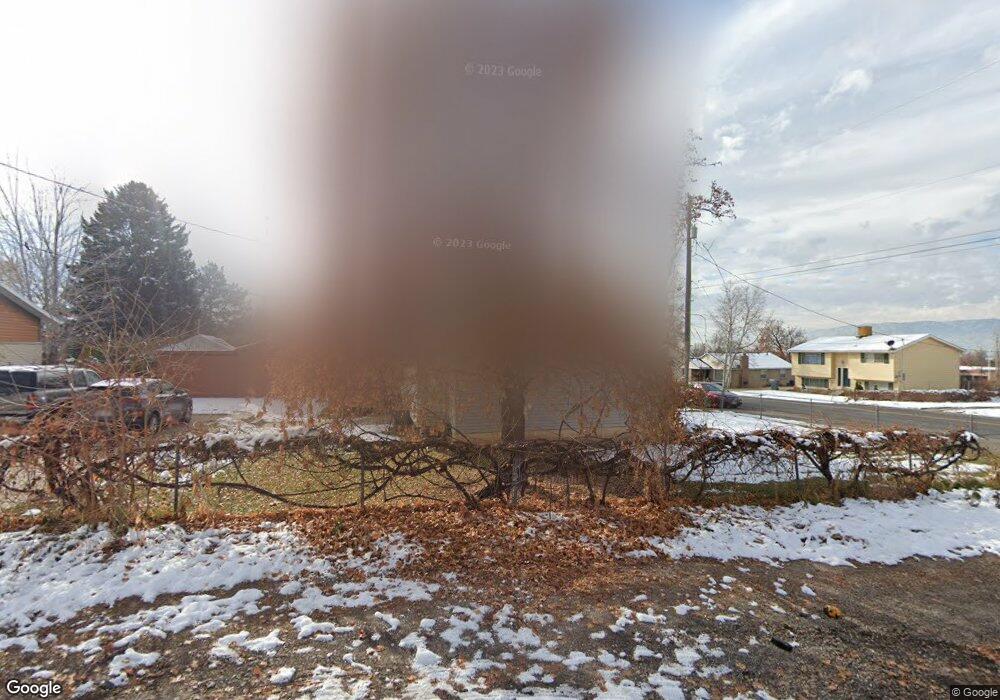
890 N 300 E Pleasant Grove, UT 84062
Estimated Value: $429,000 - $477,000
5
Beds
2
Baths
1,821
Sq Ft
$249/Sq Ft
Est. Value
About This Home
This home is located at 890 N 300 E, Pleasant Grove, UT 84062 and is currently estimated at $453,916, approximately $249 per square foot. 890 N 300 E is a home located in Utah County with nearby schools including Grovecrest Elementary School, Pleasant Grove Junior High School, and Pleasant Grove High School.
Ownership History
Date
Name
Owned For
Owner Type
Purchase Details
Closed on
Sep 24, 2024
Sold by
Greenwood Property Management Llc
Bought by
Greenwood Property Management Llc
Current Estimated Value
Purchase Details
Closed on
Feb 27, 2013
Sold by
Wells Fargo Bank Na
Bought by
Greenwood Property Management Llc
Purchase Details
Closed on
Sep 5, 2012
Sold by
Rowley Danny M
Bought by
Wells Fargo Bank Na
Purchase Details
Closed on
Jan 5, 2000
Sold by
Poulsen Troy M and Poulsen Anna Lee
Bought by
Rowley Danny M
Home Financials for this Owner
Home Financials are based on the most recent Mortgage that was taken out on this home.
Original Mortgage
$106,000
Interest Rate
7.72%
Mortgage Type
Seller Take Back
Create a Home Valuation Report for This Property
The Home Valuation Report is an in-depth analysis detailing your home's value as well as a comparison with similar homes in the area
Home Values in the Area
Average Home Value in this Area
Purchase History
| Date | Buyer | Sale Price | Title Company |
|---|---|---|---|
| Greenwood Property Management Llc | -- | None Listed On Document | |
| Greenwood Property Management Llc | -- | None Available | |
| Wells Fargo Bank Na | $144,845 | Ettile Insurance Agency | |
| Rowley Danny M | -- | Old Republic Title Company |
Source: Public Records
Mortgage History
| Date | Status | Borrower | Loan Amount |
|---|---|---|---|
| Previous Owner | Rowley Danny M | $106,000 |
Source: Public Records
Tax History
| Year | Tax Paid | Tax Assessment Tax Assessment Total Assessment is a certain percentage of the fair market value that is determined by local assessors to be the total taxable value of land and additions on the property. | Land | Improvement |
|---|---|---|---|---|
| 2025 | $1,796 | $226,765 | -- | -- |
| 2024 | $1,796 | $214,390 | $0 | $0 |
| 2023 | $1,766 | $215,820 | $0 | $0 |
| 2022 | $1,819 | $221,100 | $0 | $0 |
| 2021 | $1,569 | $290,400 | $138,400 | $152,000 |
| 2020 | $1,443 | $261,800 | $123,600 | $138,200 |
| 2019 | $1,246 | $233,800 | $113,600 | $120,200 |
| 2018 | $1,173 | $208,100 | $103,600 | $104,500 |
| 2017 | $1,066 | $100,705 | $0 | $0 |
| 2016 | $1,052 | $95,975 | $0 | $0 |
| 2015 | $1,059 | $91,465 | $0 | $0 |
| 2014 | $1,050 | $89,870 | $0 | $0 |
Source: Public Records
Map
Nearby Homes
Your Personal Tour Guide
Ask me questions while you tour the home.