Estimated Value: $432,000 - $562,000
3
Beds
3
Baths
2,330
Sq Ft
$200/Sq Ft
Est. Value
About This Home
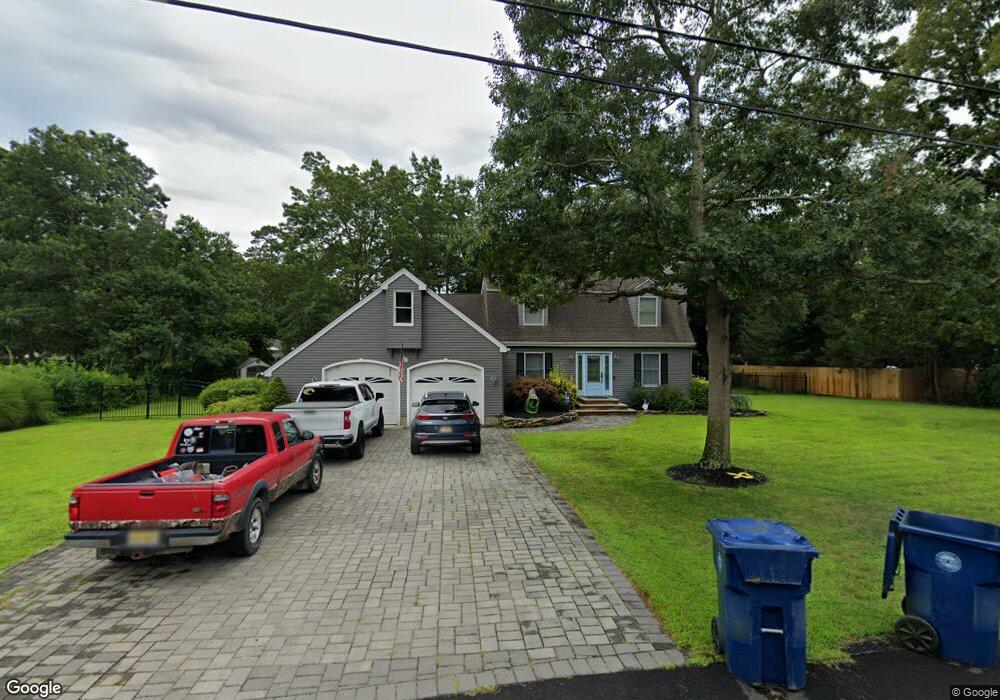
This home is located at 890 Railroad Dr, Little Egg Harbor Township, NJ 08087 and is currently estimated at $466,510, approximately $200 per square foot. 890 Railroad Dr is a home located in Ocean County with nearby schools including Frog Pond Elementary School, Pinelands Regional Junior High School, and Pinelands Regional High School.
Ownership History
Date
Name
Owned For
Owner Type
Purchase Details
Closed on
Nov 29, 2018
Sold by
Gissubel Susan L and Gissubel Frederick A
Bought by
Bray Alexander T and Debella Mcnemer Ashley M
Current Estimated Value
Home Financials for this Owner
Home Financials are based on the most recent Mortgage that was taken out on this home.
Original Mortgage
$283,500
Outstanding Balance
$249,770
Interest Rate
4.8%
Mortgage Type
New Conventional
Estimated Equity
$216,740
Purchase Details
Closed on
Oct 4, 2004
Sold by
Gissubel Susan
Bought by
Gissubel Frederick A and Gissubel Susan
Home Financials for this Owner
Home Financials are based on the most recent Mortgage that was taken out on this home.
Original Mortgage
$310,000
Interest Rate
5.8%
Mortgage Type
New Conventional
Create a Home Valuation Report for This Property
The Home Valuation Report is an in-depth analysis detailing your home's value as well as a comparison with similar homes in the area
Home Values in the Area
Average Home Value in this Area
Purchase History
| Date | Buyer | Sale Price | Title Company |
|---|---|---|---|
| Bray Alexander T | $315,000 | Surety Title Co | |
| Gissubel Frederick A | -- | Independence Abstract & Titl |
Source: Public Records
Mortgage History
| Date | Status | Borrower | Loan Amount |
|---|---|---|---|
| Open | Bray Alexander T | $283,500 | |
| Previous Owner | Gissubel Frederick A | $310,000 |
Source: Public Records
Tax History Compared to Growth
Tax History
| Year | Tax Paid | Tax Assessment Tax Assessment Total Assessment is a certain percentage of the fair market value that is determined by local assessors to be the total taxable value of land and additions on the property. | Land | Improvement |
|---|---|---|---|---|
| 2025 | $7,392 | $245,500 | $90,100 | $155,400 |
| 2024 | $7,085 | $245,500 | $90,100 | $155,400 |
| 2023 | $6,857 | $245,500 | $90,100 | $155,400 |
| 2022 | $6,857 | $245,500 | $90,100 | $155,400 |
| 2021 | $6,687 | $245,500 | $90,100 | $155,400 |
| 2020 | $6,599 | $245,500 | $90,100 | $155,400 |
| 2019 | $6,331 | $245,500 | $90,100 | $155,400 |
| 2018 | $5,978 | $245,500 | $90,100 | $155,400 |
| 2017 | $5,890 | $245,500 | $90,100 | $155,400 |
| 2016 | $5,931 | $245,500 | $90,100 | $155,400 |
| 2015 | $5,961 | $245,500 | $90,100 | $155,400 |
| 2014 | $5,513 | $286,100 | $117,300 | $168,800 |
Source: Public Records
Map
Nearby Homes