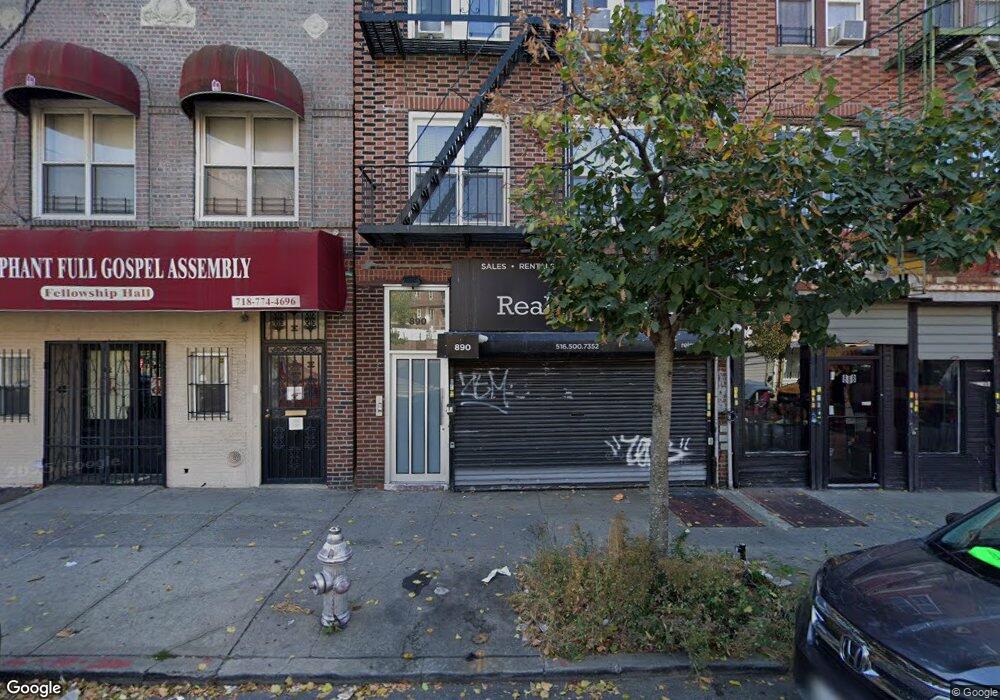
890 Rutland Rd Unit 5 Brooklyn, NY 11203
East Flatbush NeighborhoodEstimated Value: $1,074,238
--
Bed
--
Bath
5,100
Sq Ft
$211/Sq Ft
Est. Value
About This Home
This home is located at 890 Rutland Rd Unit 5, Brooklyn, NY 11203 and is currently estimated at $1,074,238, approximately $210 per square foot. 890 Rutland Rd Unit 5 is a home located in Kings County with nearby schools including P.S. 268 Emma Lazarus, East Flatbush Community Research School, and Kings Elementary School.
Ownership History
Date
Name
Owned For
Owner Type
Purchase Details
Closed on
Jun 30, 2014
Sold by
Acqua Capital Llc
Bought by
Bava Capital Llc
Current Estimated Value
Home Financials for this Owner
Home Financials are based on the most recent Mortgage that was taken out on this home.
Original Mortgage
$425,000
Outstanding Balance
$323,237
Interest Rate
4.12%
Mortgage Type
Commercial
Estimated Equity
$751,001
Purchase Details
Closed on
Jul 1, 2013
Sold by
Helene Blank Esq Referee
Bought by
Acqua Capital Llc
Purchase Details
Closed on
Dec 28, 2007
Sold by
Gabizon Realty Llc
Bought by
Tina Rutland Group Inc
Home Financials for this Owner
Home Financials are based on the most recent Mortgage that was taken out on this home.
Original Mortgage
$450,000
Interest Rate
6.21%
Mortgage Type
Commercial
Purchase Details
Closed on
Nov 17, 2005
Sold by
890 Rutland Realty Corp
Bought by
Gabizon Realty Llc
Purchase Details
Closed on
Sep 12, 1996
Sold by
Gelfond Doris and Levy Mary
Bought by
890 Realty Corp
Create a Home Valuation Report for This Property
The Home Valuation Report is an in-depth analysis detailing your home's value as well as a comparison with similar homes in the area
Home Values in the Area
Average Home Value in this Area
Purchase History
| Date | Buyer | Sale Price | Title Company |
|---|---|---|---|
| Bava Capital Llc | $675,000 | -- | |
| Bava Capital Llc | $675,000 | -- | |
| Acqua Capital Llc | -- | -- | |
| Acqua Capital Llc | -- | -- | |
| Tina Rutland Group Inc | $600,000 | -- | |
| Tina Rutland Group Inc | $600,000 | -- | |
| Gabizon Realty Llc | -- | -- | |
| Gabizon Realty Llc | -- | -- | |
| 890 Realty Corp | $135,000 | Chicago Title Insurance Co | |
| 890 Realty Corp | $135,000 | Chicago Title Insurance Co |
Source: Public Records
Mortgage History
| Date | Status | Borrower | Loan Amount |
|---|---|---|---|
| Open | Bava Capital Llc | $425,000 | |
| Closed | Bava Capital Llc | $425,000 | |
| Previous Owner | Tina Rutland Group Inc | $450,000 |
Source: Public Records
Tax History Compared to Growth
Tax History
| Year | Tax Paid | Tax Assessment Tax Assessment Total Assessment is a certain percentage of the fair market value that is determined by local assessors to be the total taxable value of land and additions on the property. | Land | Improvement |
|---|---|---|---|---|
| 2025 | $14,810 | $272,250 | $8,100 | $264,150 |
| 2024 | $14,810 | $250,650 | $8,100 | $242,550 |
| 2023 | $13,462 | $232,650 | $8,100 | $224,550 |
| 2022 | $12,437 | $238,950 | $8,100 | $230,850 |
| 2021 | $11,546 | $208,800 | $8,100 | $200,700 |
| 2020 | $5,676 | $206,100 | $8,100 | $198,000 |
| 2019 | $11,493 | $171,720 | $8,100 | $163,620 |
| 2018 | $10,737 | $84,418 | $4,778 | $79,640 |
| 2017 | $9,945 | $78,192 | $5,099 | $73,093 |
| 2016 | $9,334 | $72,400 | $5,192 | $67,208 |
| 2015 | $6,060 | $72,400 | $5,818 | $66,582 |
| 2014 | $6,060 | $70,098 | $6,606 | $63,492 |
Source: Public Records
Map
Nearby Homes
- 890 Rutland Rd
- 892 Rutland Rd
- 894 Rutland Rd
- 886 Rutland Rd
- 886 Rutland Rd Unit 5
- 900 Rutland Rd
- 73 E 51st St Unit 4
- 73 E 51st St
- 75 E 51st St Unit 4
- 77 E 51st St Unit 4
- 889 Rutland Rd
- 887 Rutland Rd
- 885 Rutland Rd
- 883 Rutland Rd
- 881 Rutland Rd
- 79 E 51st St Unit 4
- 79 E 51st St Unit 2B
- 79 E 51st St Unit 2FL
- 79 E 51st St Unit 2R
- 79 E 51st St