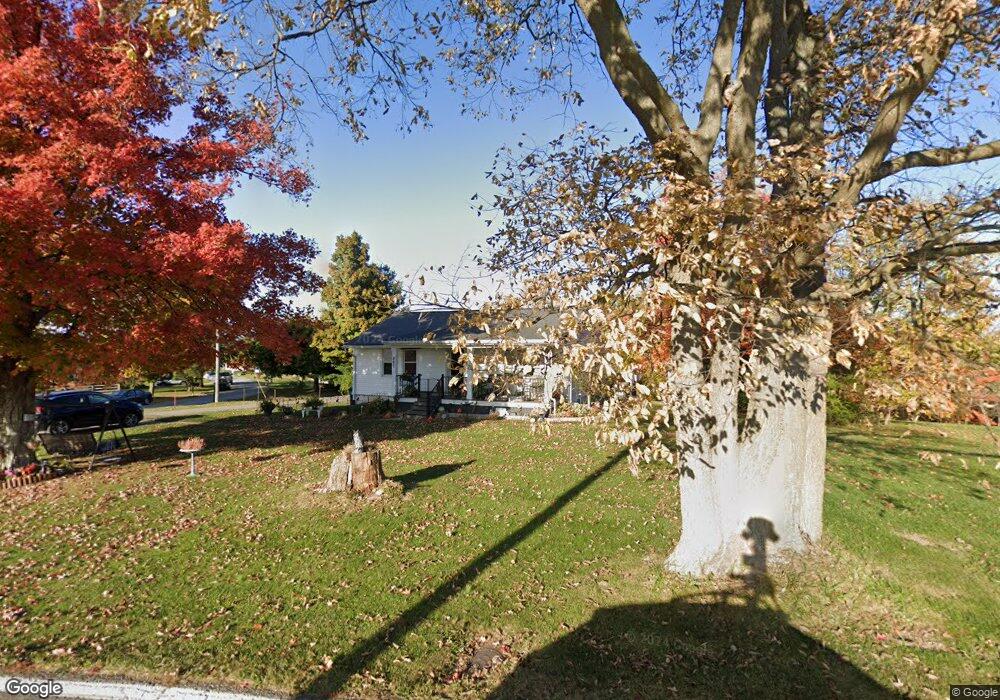
890 Stephens Rd Independence, KY 41051
Estimated Value: $178,000 - $242,000
2
Beds
1
Bath
925
Sq Ft
$227/Sq Ft
Est. Value
About This Home
This home is located at 890 Stephens Rd, Independence, KY 41051 and is currently estimated at $210,358, approximately $227 per square foot. 890 Stephens Rd is a home located in Kenton County with nearby schools including White's Tower Elementary School, Twenhofel Middle School, and Simon Kenton High School.
Ownership History
Date
Name
Owned For
Owner Type
Purchase Details
Closed on
Jun 7, 2018
Sold by
Leen Shonda L and Leen Adam M
Bought by
Deming Mark and Deming Mark Allen
Current Estimated Value
Home Financials for this Owner
Home Financials are based on the most recent Mortgage that was taken out on this home.
Original Mortgage
$120,650
Outstanding Balance
$103,901
Interest Rate
4.5%
Mortgage Type
New Conventional
Estimated Equity
$106,457
Purchase Details
Closed on
Jan 26, 2009
Sold by
Lay Jeffrey R
Bought by
Lay Shonda L and Whiteker Shonda I
Purchase Details
Closed on
Sep 9, 2003
Sold by
Powell Steven J and Powell Danita R
Bought by
Whiteker Shonda L and Lay Jeffrey R
Home Financials for this Owner
Home Financials are based on the most recent Mortgage that was taken out on this home.
Original Mortgage
$71,200
Interest Rate
5%
Mortgage Type
Purchase Money Mortgage
Purchase Details
Closed on
May 6, 2003
Sold by
Angel Beatrice J
Bought by
Powell Steven J
Create a Home Valuation Report for This Property
The Home Valuation Report is an in-depth analysis detailing your home's value as well as a comparison with similar homes in the area
Home Values in the Area
Average Home Value in this Area
Purchase History
| Date | Buyer | Sale Price | Title Company |
|---|---|---|---|
| Deming Mark | $127,000 | Springdale Title Llc | |
| Lay Shonda L | -- | None Available | |
| Lay Shonda L | -- | None Available | |
| Whiteker Shonda L | $89,000 | Kentucky Land Title Agency | |
| Powell Steven J | -- | -- |
Source: Public Records
Mortgage History
| Date | Status | Borrower | Loan Amount |
|---|---|---|---|
| Open | Deming Mark | $120,650 | |
| Previous Owner | Whiteker Shonda L | $71,200 | |
| Closed | Whiteker Shonda L | $8,811 |
Source: Public Records
Tax History
| Year | Tax Paid | Tax Assessment Tax Assessment Total Assessment is a certain percentage of the fair market value that is determined by local assessors to be the total taxable value of land and additions on the property. | Land | Improvement |
|---|---|---|---|---|
| 2025 | $1,984 | $170,600 | $35,000 | $135,600 |
| 2024 | $1,556 | $127,000 | $25,000 | $102,000 |
| 2023 | $1,603 | $127,000 | $25,000 | $102,000 |
| 2022 | $1,668 | $127,000 | $25,000 | $102,000 |
| 2021 | $1,692 | $127,000 | $25,000 | $102,000 |
| 2020 | $1,727 | $127,000 | $20,000 | $107,000 |
| 2019 | $1,732 | $127,000 | $20,000 | $107,000 |
| 2018 | $1,243 | $89,000 | $20,000 | $69,000 |
| 2017 | $1,210 | $89,000 | $20,000 | $69,000 |
| 2015 | $1,168 | $89,000 | $25,000 | $64,000 |
| 2014 | $1,152 | $89,000 | $25,000 | $64,000 |
Source: Public Records
Map
Nearby Homes
- 5510 Fowler Creek Rd
- 6681 Tullamore Ln Unit Lot 3
- 4386 Alleen Ct
- 6703 Tullamore Ln Unit Lot 7
- 798 Cox Rd
- 772 Durrow Dr Unit Lot 26
- 4448 Oliver Rd
- 810 Durrow Dr Unit Lot 14
- 4370 Oliver Rd
- 6519 Meadow Creek Dr
- 765 Jimae Ave
- 789 Stonybrook Ct
- 798 Stonybrook Ct
- 2144 Hartland Blvd
- 4394 Boston Ln
- 692 Sycamore Dr
- 685 Skyway Dr
- 718 Willow Green Dr
- 714 Willow Green Dr
- 2083 Hartland Blvd
- 906 Don Victor
- 903 Don Victor
- 911 Don Victor
- 911 Don Victor Unit 1
- 914 Don Victor
- 915 Don Victor
- 4410 Mayflower Dr
- 4413 Mayflower Dr
- 923 Don Victor
- 4406 Mayflower Dr
- 924 Don Victor
- 869 Stephens Rd
- 4409 Mayflower Dr
- 4402 Mayflower Dr
- 928 Don Victor
- 925 Don Victor
- 4401 Mayflower Dr
- 4398 Mayflower Dr
- 17 Mayflower Dr Unit 17
- 932 Don Victor
Your Personal Tour Guide
Ask me questions while you tour the home.