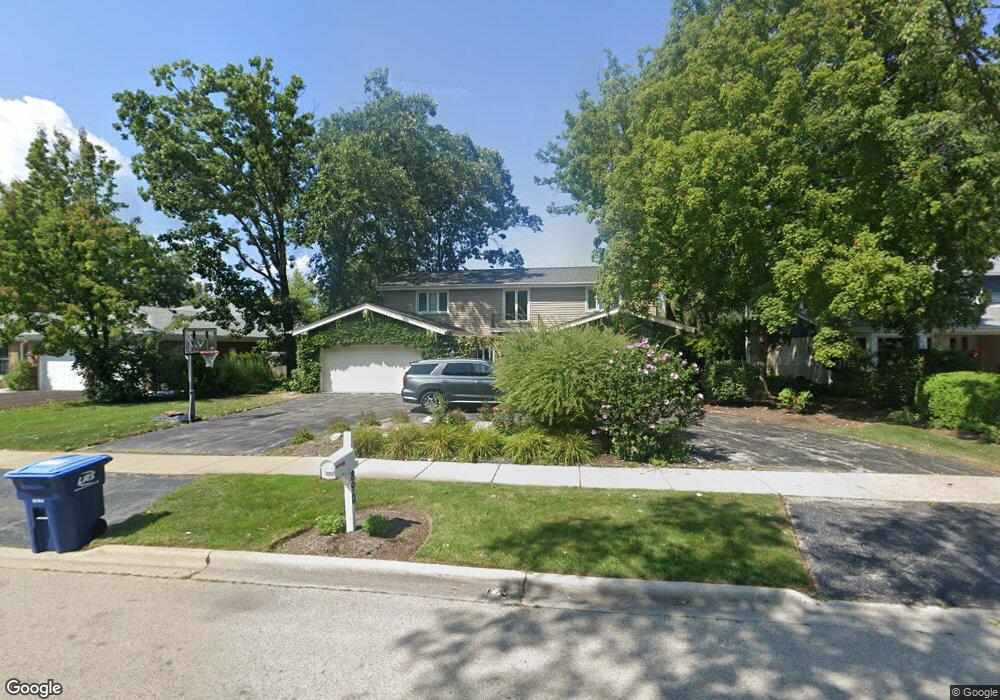
890 Summit Dr Deerfield, IL 60015
Estimated Value: $889,662 - $1,097,000
5
Beds
3
Baths
3,153
Sq Ft
$313/Sq Ft
Est. Value
About This Home
This home is located at 890 Summit Dr, Deerfield, IL 60015 and is currently estimated at $986,916, approximately $313 per square foot. 890 Summit Dr is a home located in Lake County with nearby schools including Walden Elementary School, Alan B Shepard Middle School, and Deerfield High School.
Ownership History
Date
Name
Owned For
Owner Type
Purchase Details
Closed on
Mar 22, 2017
Sold by
Cunningham Thomas E and Cunningham Christine M
Bought by
Cohn Robert M and Cohn Emily S
Current Estimated Value
Home Financials for this Owner
Home Financials are based on the most recent Mortgage that was taken out on this home.
Original Mortgage
$571,500
Outstanding Balance
$469,915
Interest Rate
3.87%
Mortgage Type
Adjustable Rate Mortgage/ARM
Estimated Equity
$517,001
Purchase Details
Closed on
Aug 16, 2004
Sold by
Garcia Beverly
Bought by
Cunningham Thomas E and Cunningham Christine M
Home Financials for this Owner
Home Financials are based on the most recent Mortgage that was taken out on this home.
Original Mortgage
$440,000
Interest Rate
5.37%
Mortgage Type
Unknown
Create a Home Valuation Report for This Property
The Home Valuation Report is an in-depth analysis detailing your home's value as well as a comparison with similar homes in the area
Home Values in the Area
Average Home Value in this Area
Purchase History
| Date | Buyer | Sale Price | Title Company |
|---|---|---|---|
| Cohn Robert M | $635,000 | Chicago Title | |
| Cunningham Thomas E | $640,000 | Ticor Title Insurance Compan |
Source: Public Records
Mortgage History
| Date | Status | Borrower | Loan Amount |
|---|---|---|---|
| Open | Cohn Robert M | $571,500 | |
| Previous Owner | Cunningham Thomas E | $440,000 | |
| Closed | Cunningham Thomas E | $104,000 |
Source: Public Records
Tax History
| Year | Tax Paid | Tax Assessment Tax Assessment Total Assessment is a certain percentage of the fair market value that is determined by local assessors to be the total taxable value of land and additions on the property. | Land | Improvement |
|---|---|---|---|---|
| 2024 | $19,540 | $224,739 | $55,794 | $168,945 |
| 2023 | $20,890 | $215,680 | $53,545 | $162,135 |
| 2022 | $20,890 | $226,556 | $59,811 | $166,745 |
| 2021 | $19,712 | $218,431 | $57,666 | $160,765 |
| 2020 | $18,958 | $218,890 | $57,787 | $161,103 |
| 2019 | $18,527 | $218,519 | $57,689 | $160,830 |
| 2018 | $16,986 | $208,989 | $61,145 | $147,844 |
| 2017 | $16,852 | $208,322 | $60,950 | $147,372 |
| 2016 | $16,391 | $200,444 | $58,645 | $141,799 |
| 2015 | $16,061 | $188,334 | $55,102 | $133,232 |
| 2014 | $16,808 | $194,073 | $55,497 | $138,576 |
| 2012 | $16,393 | $192,361 | $55,007 | $137,354 |
Source: Public Records
Map
Nearby Homes
- 1423 Northwoods Rd
- 2045 Kipling Ct
- 1630 Ridge Rd
- 1800 Telegraph Rd
- 1165 Linden Ave
- 1525 Hawthorne Place
- 1380 Valley Rd
- 1343 Oxford Rd
- 1725 Lilly Ct
- 1851 Cooper Ln
- 1030 Chestnut St
- 1127 Kenton Rd
- 1832 Eastwood Ave
- 1839 Shelley Ct
- 2325 Shady Ln
- 1054 Broadmoor Place
- 938 Hemlock St
- 1004 Broadmoor Place
- 834 Chestnut St
- 1672 Huntington Ln
- 900 Summit Dr
- 880 Summit Dr
- 870 Summit Dr
- 920 Summit Dr
- 1750 E Summit Ct
- 860 Summit Dr
- 1755 E Summit Ct
- 930 Summit Dr
- 925 Summit Dr
- 1740 E Summit Ct
- 1745 E Summit Ct
- 840 Summit Dr
- 935 Summit Dr
- 1760 Portage Pass
- 950 Summit Dr
- 1730 E Summit Ct
- 945 Summit Dr
- 830 Summit Dr
- 1750 Portage Pass
- 1725 Mountain Ct
Your Personal Tour Guide
Ask me questions while you tour the home.