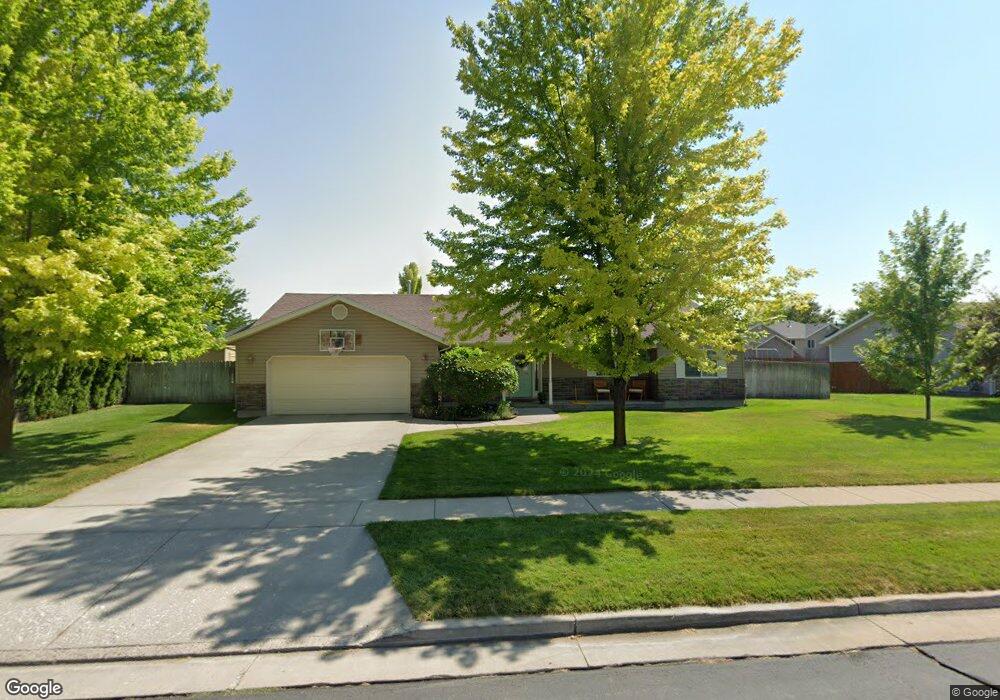
890 W 2770 S Nibley, UT 84321
Estimated Value: $448,082 - $501,000
4
Beds
2
Baths
2,084
Sq Ft
$227/Sq Ft
Est. Value
About This Home
This home is located at 890 W 2770 S, Nibley, UT 84321 and is currently estimated at $473,021, approximately $226 per square foot. 890 W 2770 S is a home located in Cache County with nearby schools including Nibley School, Spring Creek Middle School, and South Cache Middle School.
Ownership History
Date
Name
Owned For
Owner Type
Purchase Details
Closed on
Jun 7, 2018
Sold by
Larsen Stephen L and Christine Larsen R
Bought by
Taylor Scott C
Current Estimated Value
Home Financials for this Owner
Home Financials are based on the most recent Mortgage that was taken out on this home.
Original Mortgage
$125,000
Outstanding Balance
$107,647
Interest Rate
4.5%
Mortgage Type
New Conventional
Estimated Equity
$365,374
Purchase Details
Closed on
Aug 29, 2014
Sold by
Larsen Stephen L and Christine Larsen R
Bought by
Larsen Family Trust and Larsen R Christine
Purchase Details
Closed on
Jun 26, 2013
Sold by
Clark Michael D and Clark Kaydee E
Bought by
Larsen Stephen L and Christine Larsen R
Home Financials for this Owner
Home Financials are based on the most recent Mortgage that was taken out on this home.
Original Mortgage
$191,020
Interest Rate
3.48%
Mortgage Type
VA
Create a Home Valuation Report for This Property
The Home Valuation Report is an in-depth analysis detailing your home's value as well as a comparison with similar homes in the area
Home Values in the Area
Average Home Value in this Area
Purchase History
| Date | Buyer | Sale Price | Title Company |
|---|---|---|---|
| Taylor Scott C | -- | American Secure Title Logan | |
| Larsen Family Trust | -- | None Available | |
| Larsen Stephen L | -- | American Secure Title Logan |
Source: Public Records
Mortgage History
| Date | Status | Borrower | Loan Amount |
|---|---|---|---|
| Open | Taylor Scott C | $125,000 | |
| Previous Owner | Larsen Stephen L | $191,020 |
Source: Public Records
Tax History Compared to Growth
Tax History
| Year | Tax Paid | Tax Assessment Tax Assessment Total Assessment is a certain percentage of the fair market value that is determined by local assessors to be the total taxable value of land and additions on the property. | Land | Improvement |
|---|---|---|---|---|
| 2025 | $1,633 | $216,525 | $0 | $0 |
| 2024 | $1,745 | $217,135 | $0 | $0 |
| 2023 | $1,828 | $212,970 | $0 | $0 |
| 2022 | $1,902 | $212,970 | $0 | $0 |
| 2021 | $1,856 | $322,775 | $65,000 | $257,775 |
| 2020 | $1,586 | $262,467 | $65,000 | $197,467 |
| 2019 | $1,663 | $262,466 | $65,000 | $197,466 |
| 2018 | $1,407 | $216,710 | $45,000 | $171,710 |
| 2017 | $1,356 | $110,605 | $0 | $0 |
| 2016 | $1,371 | $110,605 | $0 | $0 |
| 2015 | $1,138 | $92,360 | $0 | $0 |
| 2014 | $1,112 | $92,360 | $0 | $0 |
| 2013 | -- | $92,360 | $0 | $0 |
Source: Public Records
Map
Nearby Homes